The 1982-83 El Nino
Introduction
Beginning in the summer of 1982, one of the strongest El Nino
events occurred since records have been kept of these events (1958). El Nino, an unusual
warming of the ocean waters in the east and central Pacific, indirectly affected
the United States with heavy rains and mountain snows in California, a
below-average snow season for the northern and northeastern
U.S. ski
resorts, as well as below normal hurricane and tropical storm activity in
the Atlantic and the Gulf of Mexico. It's important to note that these
events were influenced by the El Nino in the Pacific, but not caused by it.
These events were mainly due to the shift in the Jet Stream and storm track from
its usual northerly course to a more southerly location. This shift moved
its usual precipitation habits to areas not used to so much or so little
compared to their normal year expectations. In addition, this shift in the
course of the Jet Stream affected the steering currents in the Gulf of Mexico
and the Atlantic Ocean, affecting the development and track of tropical cyclone
activity.
California, Gulf Coast, Hurricane Season, and
Other Global Effects
According to the
USGS Science for a Changing World report on the 1982-83 El Nino Coastal
Erosion: San Mateo Cty., CA (by Kenneth R. Lajoie and Scott A. Mathieson),
San Mateo County suffered heavy surf, severe beach erosion, and major damage to
roads and coastline due to landslides and wave action. In addition, this
report, written prior to the 1997-98 El Nino occurrence, indicated that the
purpose of this report was to provide data for use in preparation for the
predicted 1997-98 El Nino. Indeed, the 1982-83 El Nino took scientists by
surprise, as noted in the
Reports to the Nation On Our Changing Planet: El Nino and Climate Prediction
report. This report states that "the 1982-83 El Nino, by many measures the
strongest thus far this century, was not predicted and not even recognized by
scientists during its early stages." ... because "it was not preceded by a
period of stronger than normal easterlies on the equator" and "this particular
event also set in unusually late in the calendar year." The onset of this
El Nino occurred in May 1982 when the Trades weakened, the Thermocline shifted,
and the warm waters flowed into the Eastern and Central Pacific, leaving cooler
waters in the normally warm Western Pacific. This shift caused the
normally wet Western Pacific to experience dry conditions, and the normally
clear and dry Eastern and Central Pacific to have rain and flooding. This
shift is also the indirect cause of the shift in the storm track, which
influenced California's rainfall and mountain snow, as well as the steering
currents for tropical systems in the Gulf of Mexico and Atlantic, since the Jet
Stream reacted to the changes in winds and sea level pressure.
Another excerpt from this report shows the widespread Global effects attributed to the influence of this strong El Nino (though remember, no one event can be directly attributed to El Nino, but El Nino can be the cause of the conditions coming together for these events to occur):
"... the economic impacts of the 1982-83 El Nino were large. Along the South American coast, the losses overshadowed the windfalls. The fishing industries in Ecuador and Peru suffered heavily when their anchovy harvest failed and their sardines unexpectedly moved south into Chilean waters. Farther to the west, abnormal wind patterns steered typhoons off their usual tracks to islands such as Hawaii and Tahiti, which are unaccustomed to such severe weather. They also caused the monsoon rains to fall over the central Pacific instead of on the western side, which led to droughts and disastrous forest fires in Indonesia and Australia. Winter storms battered southern California and caused widespread flooding across the southern United States, while northern ski resort owners complained of unusually mild weather and a lack of snow. Overall, the loss to the world economy in 1982-83 as a result of the climate changes amounted to over $8 billion. The toll in terms of human suffering is much more difficult to estimate."
The strong 1982-83 El Nino warmed the waters of the equatorial Eastern and Central Pacific by 3.5+ degrees Celsius. Scientists declare an El Nino event if the sea surface temperatures (SSTs) exceed 0.5 degrees Celsius on average for three months straight. This is an indicator of how strong this event was compared to other El Nino events.
Normal Year Conditions - The Walker
Circulation, Trade Winds, and Thermocline
One of the things that heralds the onset of an El Nino period is
a weakening of the Trade Winds. Another is when the Walker Circulation is
reversed causing the normally warm waters and wet conditions over the Western
Pacific to shift to the East/Central Pacific, which is normally dry with cooler
waters. This causes the flow of air from high pressure to low pressure to
switch from west-to-east to east-to-west, which goes against the westward moving
Trades. The Walker Circulation shifts along with a shift in the
Thermocline, which is the gradient tilt that separates the warmer surface water
from the cooler deeper water. The Thermocline shifts due to the effects of
the weakened Trades and/or from Kelvin waves, which are eastward moving waves
that can be initiated by Rossby waves (long, slow-moving waves developed in
response to the drag created by the Trades that become Kelvin waves upon
bouncing off of a western land boundary) or by westerly bursts of winds from
eastward moving equatorial tropical thunderstorm systems). In a nutshell,
the Thermocline shifts because winds and waters are moving eastward rather than
westward with the Trades, therefore causing the upwelling of warmer waters in
the Central/Eastern Pacific, and cooler waters upwelling in the Western Pacific.
More on how this works later. It's important to note here that all of
these are theories based on observations and research that is still ongoing, as
no set of criteria have been determined to be the actual cause of an El Nino
event.
The Walker Circulation is the basic setup of the equatorial Pacific Ocean. The Trade Winds blow west, dragging across the surface waters, which causes the water to collect at the western end of the Pacific Basin. This creates a greater volume of warm water in the west and thus lower water pressure. The cooler water deeper down then flows toward the eastern end of the Pacific Basin, where its volume collects, and since cooler water is more dense, the water pressure is higher here. The Thermocline becomes tilted with a shallow layer of warm water to the east and a deeper layer of warm water to the west. Since cooler water is near the surface in the eastern Pacific, subsidence inhibits convection, and atmospheric conditions remain clear and dry (higher barometric pressure). The warmer waters in the western Pacific promote convection with rising air currents, thus giving us cloudy and wet conditions (lower barometric pressure). This is the normal Walker Circulation scenario.
As the Trade Winds blow across the water, the water just under the surface is moved at a 45º angle due to the effects of the Earth's spin (this momentum of the Earth is called the Coriolis Force). In turn, the deeper waters are moved another 45º causing them to move at a 90º angle to the direction of the wind. This displacement of surface waters causes upwelling from the depths, which is normally cooler water being brought to the surface. Due to the tilt of the Thermocline, the upwelling waters in the East Pacific are cooler than the waters upwelling in the West Pacific, which aids in keeping the Walker Circulation persistent.
When the Trade Winds weaken due to a burst of westerly winds from a thunderstorm system moving east near the equator, or from a Kelvin wave moving the warmer waters east and changing the tilt of the Thermocline, then the Walker Circulation reverses, bringing clear and dry conditions to the Western Pacific and cloudy and wet conditions to the Central and Eastern Pacific. If the sea surface temperatures remain on average 0.5 degrees Celsius above normal for three months, the onset of an El Nino is declared. Normally cool waters get warmer (affecting the Humboldt Current) and normally warm waters cool down, normally wet conditions turn dry and normally dry conditions turn stormy, and the winds don't carry the air as they usually do.
The 1982-83 El Nino as Compared to Normal
Years 1980-81
The 1982-83 El Nino was one of the
stronger occurrences since records have been kept. I've put together a
series of chart comparisons below showing conditions during the normal year of
1980-81 and the 1982-83 El Nino year. Also, I've shown some anomaly
graphics to illustrate how El Nino overall differs from normal Walker
Circulation conditions.
Walker Circulation
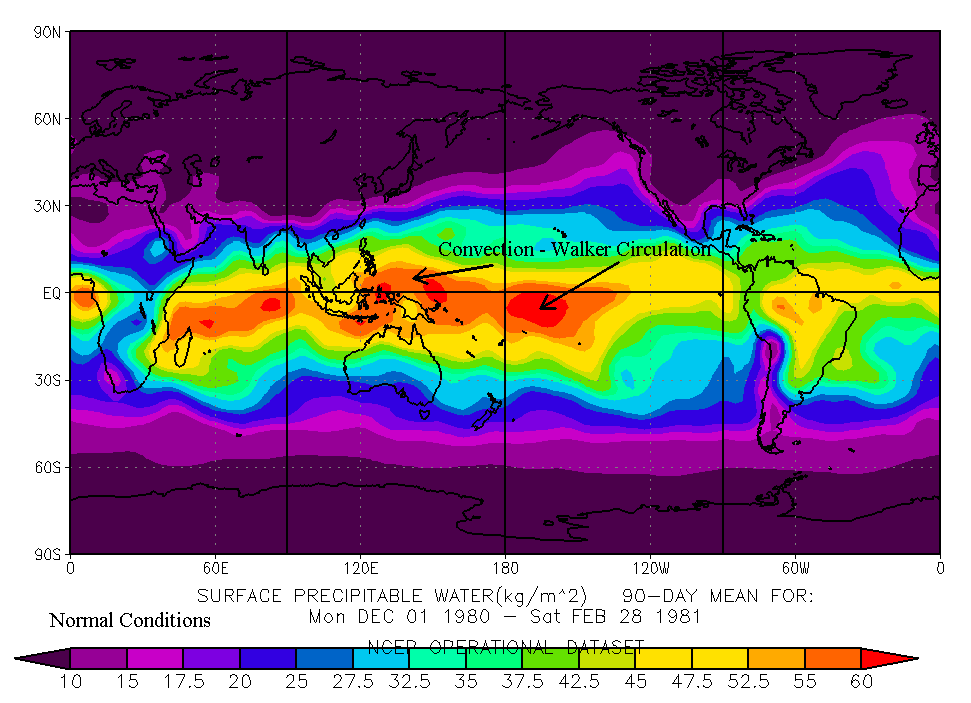
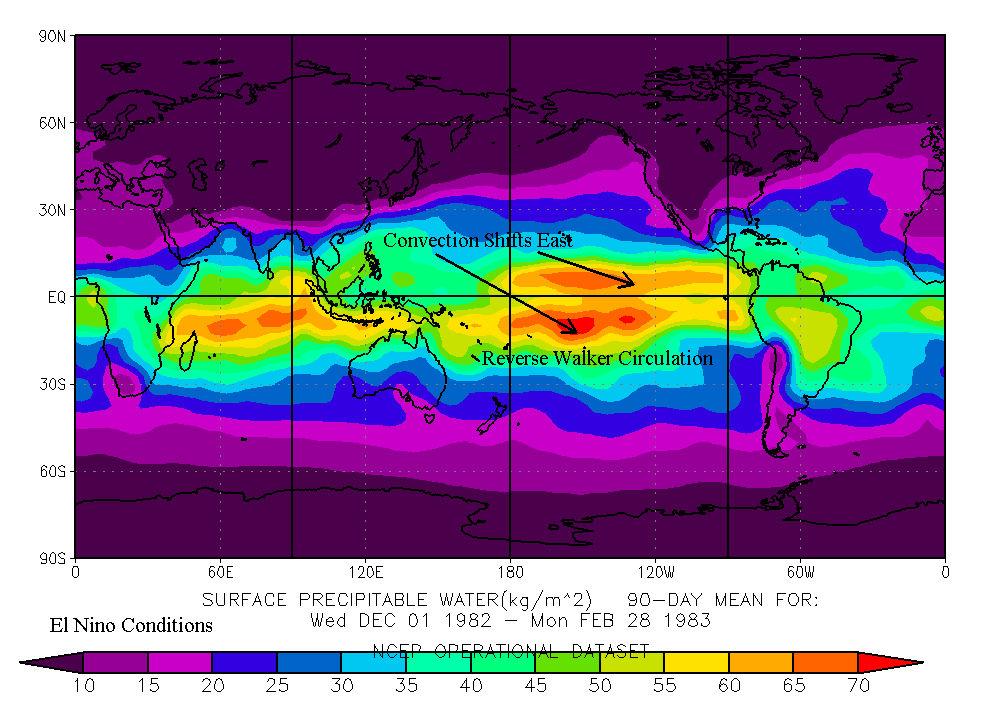
The set of charts below illustrate
the shift of convection and subsidence in the Walker Circulation under normal
conditions - 1980-81 was a normal year - and under El Nino conditions in
1982-83.
 |
|
Surface Precipitable Water 90-Day Mean for Dec-Feb 1980-81 (normal conditions), courtesy of NOAA-CIRES Climate Diagnostics Center, Atmospheric Variables Plotting Page at Composite ENSO Plots. |
 |
|
Surface Precipitable Water 90-Day Mean for Dec-Feb 1982-83 (El Nino conditions), courtesy of NOAA-CIRES Climate Diagnostics Center, Atmospheric Variables Plotting Page at Composite ENSO Plots. |
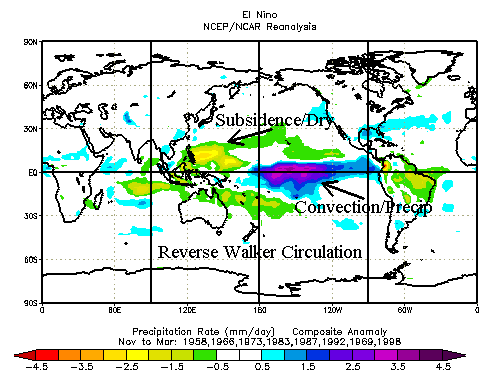
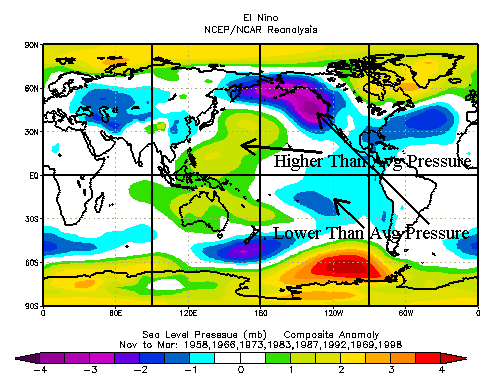
The anomaly of El Nino years compared to normal years shows a fairly consistent reverse of Walker Circulation conditions in the left chart below. (Amomalies indicate abnormal conditions compared to normal conditions.) In addition, sea level pressure (barometric) anomalies are illustrated in the right chart. This shows the higher pressures in the Western Pacific over cooler than average waters, and the lower pressures in the East/Central Pacific over warmer than average waters. Notice the large purple area over the U.S. Northwest. This is showing the wetter than average weather that brought so much rain to California. Also, the blue over the Gulf Coast area indicates more than average rainfall. Low pressure areas are conducive to convection and storm formation. The calculation for the sea level pressure anomaly is called the SOI (Southern Oscillation Rate), and is based on the difference between departures from average barometric pressures at Tahiti and Darwin, Australia. Positive departures indicate El Nino conditions, and negative departures depict La Nina conditions (again, the opposite of El Nino, though not as bold).
 |
|
Precipitation Rate Anomaly Nov-Mar comparison for El Nino years 1948-1998, courtesy of NOAA-CIRES Climate Diagnostics Center, ENSO Response Comparison Page at Composite ENSO Plots. |
 |
|
Sea Level Pressure Anomaly Nov-Mar comparison for El Nino years 1948-1998, courtesy of NOAA-CIRES Climate Diagnostics Center, ENSO Response Comparison Page at Composite ENSO Plots. (Barometric Pressure) |
Jet Stream and Storm
Track
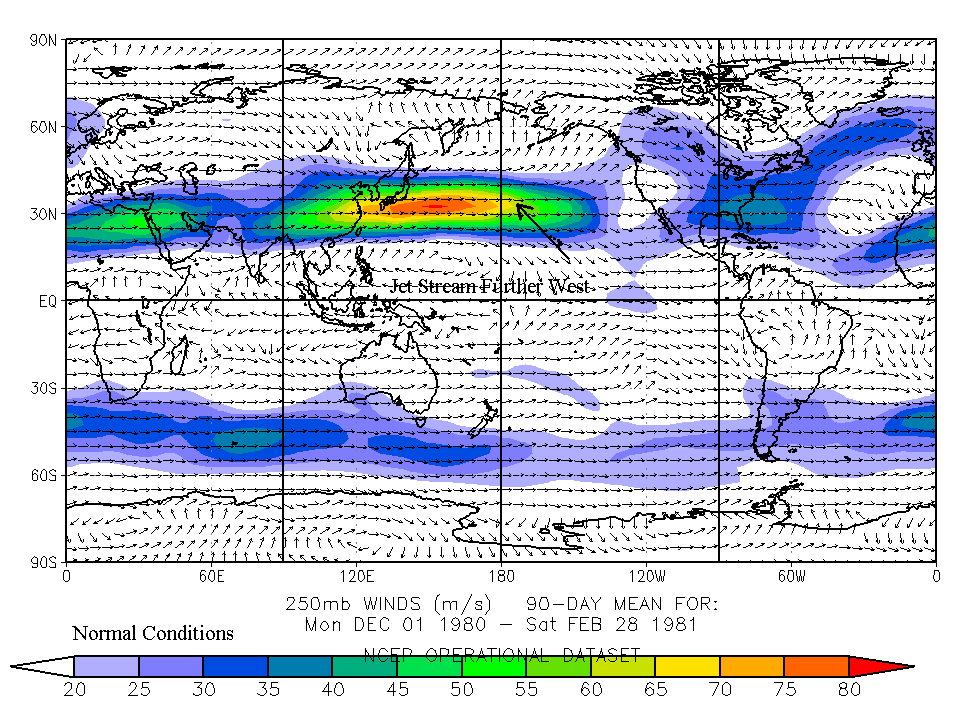
The set of charts below show the
Jet Stream shift in a normal year (1980-81) versus the El Nino year of 1982-83.
 |
|
Vector Winds at 250 mb 90-Day Mean for Dec-Feb 1980-81 (normal conditions), courtesy of NOAA-CIRES Climate Diagnostics Center, Atmospheric Variables Plotting Page at Composite ENSO Plots. |
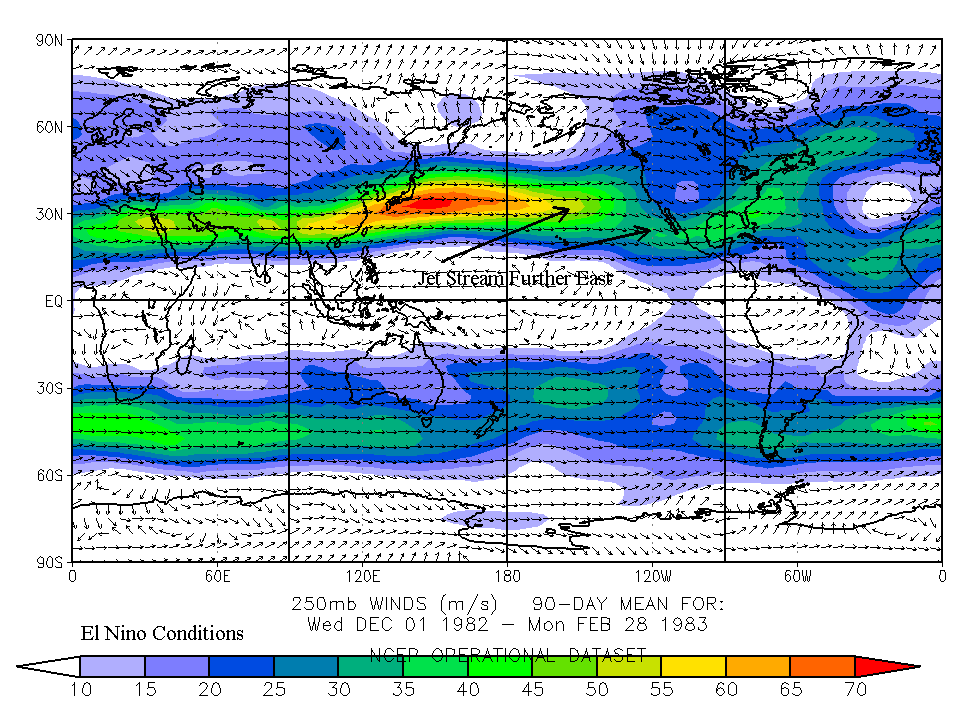 |
|
Vector Winds at 250 mb 90-Day Mean for Dec-Feb 1982-83 (El Nino conditions), courtesy of NOAA-CIRES Climate Diagnostics Center, Atmospheric Variables Plotting Page at Composite ENSO Plots. |
As the Jet Stream shifts eastward, the left-exit region of the Jet Streak (where upper level divergence initiates a frontal low to form, bringing rainy/stormy conditions) moves closer to the West Coast of the United States (see chart below). This is what brings wetter than average weather to California, including more than average snow in the mountains, thus making this event an effect influenced by El Nino conditions. Not caused, but influenced. And to what do we attribute this shift in the Jet Stream and how is it connected to El Nino? The warming conditions brought on by El Nino cause a large north-to-south temperature gradient in the upper levels of the atmosphere, which produced a bipolar field of height anomalies, allowing the Jet Stream to surge eastward. Also note the storm track over the southern U.S. and into the Atlantic, which is the probably cause of the weakened Tropical Cyclone season for 1982 and 1983 (compared to normal years 1980 and 1981).
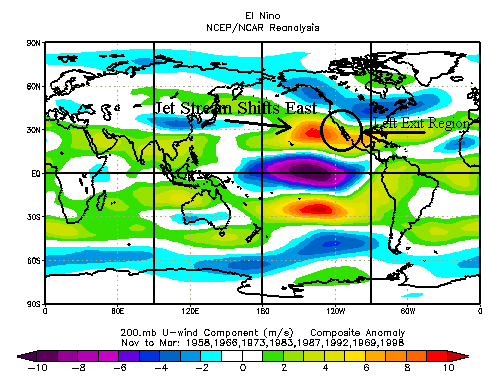 |
|
Zonal 200 mb Winds Anomaly Nov-Mar comparison for El Nino years 1948-1998, courtesy of NOAA-CIRES Climate Diagnostics Center, ENSO Response Comparison Page at Composite ENSO Plots. |
Even though you cannot blame El Nino directly for any precipitation or temperature anomaly, the set of charts below show that El Nino is fairly consistent in affecting these conditions whenever it is present. Some El Nino years are stronger and longer than others, as evidenced here, but the indirect affects still occur frequently. I have circled the 1982-83 El Nino map for easier comparison. 1982-83 was a pretty strong El Nino year.
 |
|
Cold Season Precipitation Dec-Feb 3-month average for El Nino years 1941-1992, courtesy of NOAA-CIRES Climate Diagnostics Center, ENSO Response Comparison Page at Composite ENSO Plots. Circled are the 3-month average precipitation rates for the United States for Dec-Feb 1982-83. |
 |
|
Cold Season Temperatures Dec-Feb 3-month average for El Nino years 1941-1992, courtesy of NOAA-CIRES Climate Diagnostics Center, ENSO Response Comparison Page at Composite ENSO Plots. Circled are the 3-month average temperatures for the United States for Dec-Feb 1982-83. |
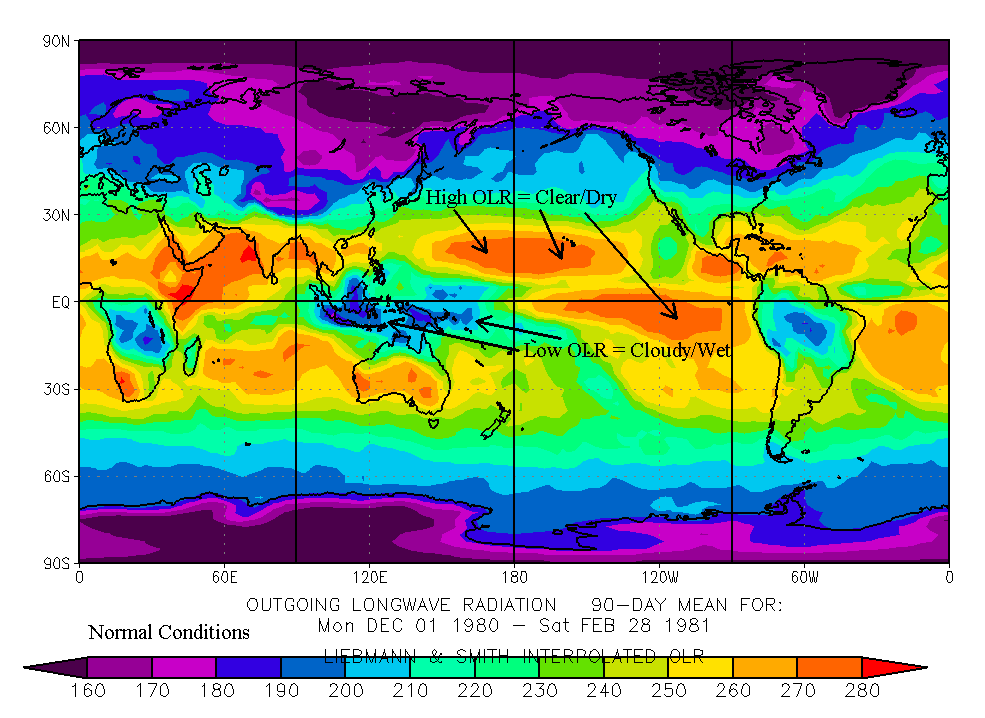
Outgoing Longwave
Radiation
Along these same lines, another
indicator we can use to see how El Nino conditions affected the Walker
Circulation is Outgoing Longwave Radiation (OLR). OLR is an indicator of
how much of this radiation is being reflected back to space due to clear vs.
cloudy conditions. High OLR shows clear and dry conditions as more
radiation is being released into the atmosphere, and low OLR shows cloudy and
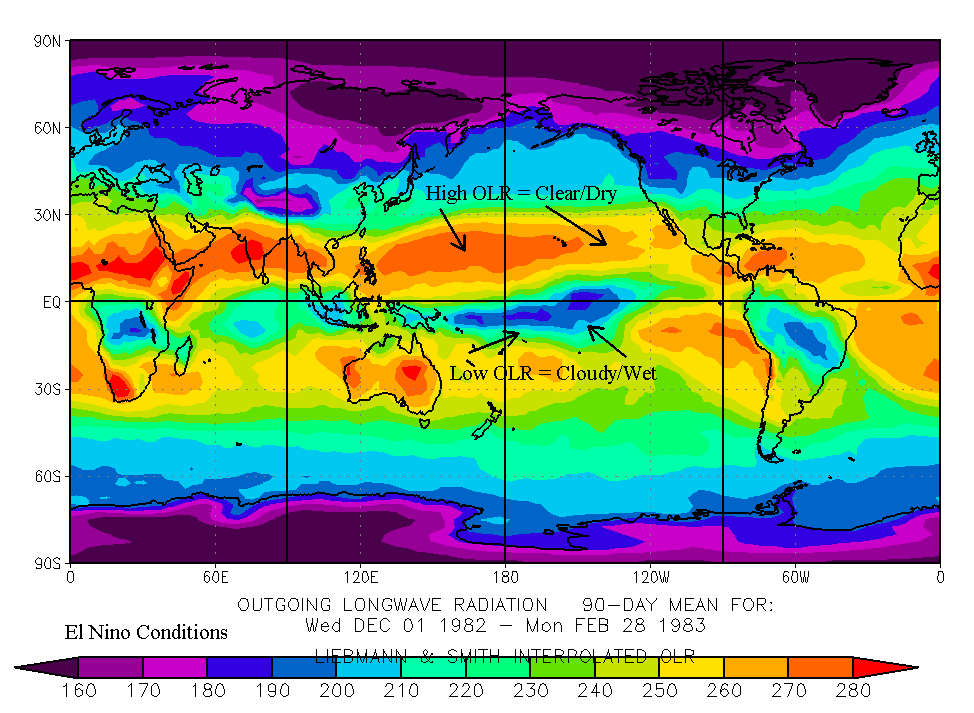
wet conditions, indicating convection and storms. Below is a set of charts
that clearly show the reversal of the Walker Circulation from the normal year of
1980-81 and the El Nino year of 1982-83.
 |
|
Outgoing Longwave Radiation 90-Day Mean for Dec-Feb 1980-81 (normal conditions), courtesy of NOAA-CIRES Climate Diagnostics Center, Atmospheric Variables Plotting Page at Composite ENSO Plots. |
 |
|
Outgoing Longwave Radiation 90-Day Mean for Dec-Feb 1982-83 (El Nino conditions), courtesy of NOAA-CIRES Climate Diagnostics Center, Atmospheric Variables Plotting Page at Composite ENSO Plots. |
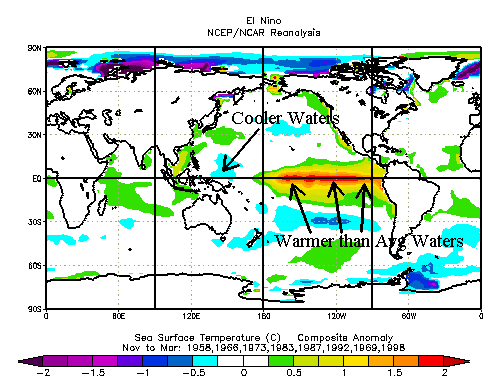
Sea Surface
Temperatures and Sea Level Pressure
In addition to major wind shifts,
the warmer waters in the Eastern Pacific cause nutrients in cool, shallow
surface water (the boundary is called the Nitrocline) to move deeper in order to
find the cooler waters. Upwelling water, therefore, has less of these
nutrients. Since these nutrients sustain marine life, this severely
impacts the food chain and the fish market. Sea Surface Temperatures are
actually the first indicator of an approaching El Nino season. Remember
that the warmer waters undermining the Humboldt Current was what we began this
narrative with, and SSTs above average for three months straight are the
indicators meteorologists use to declare El Nino conditions. As few as .05
degrees Celsius can affect ships at sea, the fishing industry, the health and
well-being of wildlife, crops (floods vs. drought), property, and lives.
Amazing. Here's the last chart, showing the anomalies of SSTs during El
Nino years. I've also included this time a chart for summer 1982, to show
the development of the onset in May-September. The rest of the anomaly
charts are for the peak El Nino period of winter, spanning November-March.
 |
|
Sea Surface Temperature Anomaly Nov-Mar comparison for El Nino years 1948-1998, courtesy of NOAA-CIRES Climate Diagnostics Center, ENSO Response Comparison Page at Composite ENSO Plots. (Winter) |
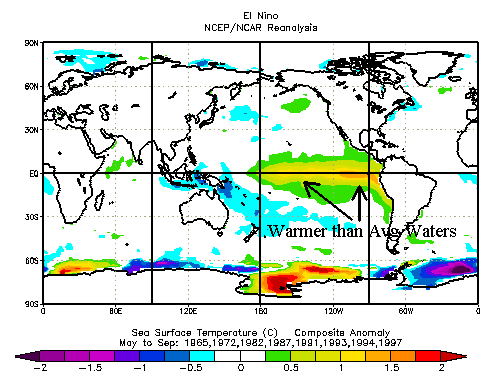 |
|
Sea Surface Temperature Anomaly May-Sep comparison for El Nino years 1948-1998, courtesy of NOAA-CIRES Climate Diagnostics Center, ENSO Response Comparison Page at Composite ENSO Plots. (Summer) |
The Hurricane Seasons of 1982 and 1983
In the Introduction to this lesson, our instructor (Lee Grenci)
outlined the 1997 Atlantic hurricane season, noting that there were noticeably
less named storms (7), less hurricane strength storms (3), and less major
hurricanes (Category 3-5 on the
Saffir-Simpson
Hurricane Scale) than an average hurricane season. On average, the
numbers are 10 named storms, 5-6 hurricane status storms, and 2-3 major
hurricanes. This piqued my interest, as I love histories and comparisons.
So I researched the 1982-83 hurricane season to compare that El Nino year with
the 1997-98 El Nino year. I went to the
NHC-TPC Archive
of Past Hurricanes and found files dating back to 1958 for the Atlantic,
Caribbean, and Gulf of Mexico. The full statistics for the storms can be
accessed
at the
Hurricane Seasons 1982-1983 webpage.
In the 1982 tropical season, there were only five (5) named storms. Two (2) made hurricane status, and only one (1) reached major hurricane strength (a Category 4 with my name, Debby (though spelled differently), no less!). The timing of the storms was within normal parameters (June 2 - October 2), but only one made landfall (Tropical Storm Chris on September 11, 1982 at Port Arthur, TX/Lake Charles, LA). The rest spent their entire time over water, including the Category 4 Debby. Hurricane Alberto (Cat 1) formed June 2 over the Yucatan/Gulf of Mexico, Tropical Storm Beryl formed August 28 from Cape Verde, Hurricane Debby (Cat 4) formed September 13 from Cape Verde, and Tropical Storm Ernesto formed September 30 in the North Atlantic. There was one interesting note, though. A subtropical storm formed June 18 in the Gulf of Mexico, made landfall in Brevard County, northern Florida, moved out into the Atlantic, and became an extratropical storm south of Newfoundland. The Preliminary Report signed by JMP 7/15/82 on the website reads as follows:
"A subtropical depression developed rapidly over the eastern Gulf of Mexico on June 18. It resulted from interaction of a tropical disturbance moving northward from the Yucatan Peninsula and an upper level trough in the westerlies advancing from Texas. Although such an occurrence is unusual, a remarkably similar storm formed in the same area during June 1974."
The 1983 tropical system saw only four (4) named storms, three (3) made hurricane status, and none (0) reached major hurricane strength. Two (2) of the three (3) hurricanes made landfall, as did Tropical Storm Dean. Hurricane Alicia formed in the Gulf of Mexico on August 15 and made landfall on August 18 25 miles south of Galveston, TX as a minimal Category 3 storm. Hurricane Barry (Cat 1) formed from Cape Verde on August 23 and made landfall on August 28 as a Tropical Depression in central Florida. Hurricane Chantal formed near Bermuda on September 10 and did not make landfall. And Tropical Storm Dean formed on September 22 from subtropical origins in the Atlantic (from a frontal cloud band off the East Coast that became stationary from the Bahamas northeastward beyond Bermuda), developed tropical characteristics on September 26, and made landfall on September 30 in Virginia. Hurricane Alicia is worth noting again because it was "the first storm where landfall probabilities were issued by the National Weather Service." Also from the Preliminary Report (not signed) on the website:
"Hurricane Alicia was the first hurricane to strike the continental United States since Hurricane Allen moved over extreme south Texas on 10 August 1980. The three years and 8 days between these strikes is the longest period in this century that the United States mainland has gone without a hurricane landfall. The next longest period was from 28 September 1929 to 14 August 1932."
As noted in the section on global effects above, the lowered activity of tropical systems in the Gulf of Mexico and Atlantic Ocean can be indirectly attributed to El Nino since the Jet Stream shifted its storm track to a more southerly location across the U.S. These fast, upper-level winds have the capability to inhibit development and westward movement of tropical systems due to wind shear and upper-level steering winds. However, more analysis needs to be done to determine how much El Nino is responsible for this weak Hurricane season.
Endpiece
Learning how to research, finding and utilizing various tools
and resources, was the most rewarding part of this assignment. In
addition, researching the hurricane seasons for this El Nino year was extremely
interesting to me, as I have a penchant for storm histories. Being able to
find visual indications of noted conditions was very helpful in understanding
the changes that took place and the interplay with other types of weather and
climate conditions. And bringing the whole subject down to the lone
Peruvian fisherman, distressed by the absence of his usual catch of sardines,
yet gladdened by the "unexpected harvest of warm-water scallops that washed
ashore on the coast of Ecuador." [Reports
to the Nation On Our Changing Planet: El Nino and Climate Prediction]
In addition, "shrimp production set records" in the El Nino-flooded coastal
deserts, "but so, too, did the number of mosquito-borne malaria cases." [Reports
to the Nation On Our Changing Planet: El Nino and Climate Prediction]
I enjoyed learning those tidbits of information along with the big picture.
This has encouraged a future project, an addition to this e-portfolio. Using the resources cited for the charts above, I can go back and select the Atlantic Ocean to compare the SSTs, OLR, SLP, Precipitation Rate, and Jet Stream location to see what part of El Nino might have indirectly had this effect on the 1982-83 Tropical Seasons. Of course, the climatology of the Atlantic hurricane basin has historically shifted phases of activity periodically, which has nothing to do with El Nino or La Nina. But I think it would be worth investigating to determine how far-reaching the effects of El Nino can be. Also, it would help to determine if El Nino events would be a precursor to weakened or heightened tropical cyclone activity (depending on what part of the globe, Atlantic or Pacific).
As for reflections on this project, I found it fascinating to see the anomalies and chain-reactions of conditions that were caused by something so subtle as a few degrees difference in sea surface temperature. Also, the interactions of so many and diverse weather and climate occurrences is a fascinating play in harmony and cause-and-effect. When thinking of an El Nino event, one thinks of dominos. I've heard talk of El Nino but never understood its nuances and implications. I found this project very enlightening in all the different factors that go into the making of an El Nino scenario.
Debbie Jarvis-Ferguson
Meteo 241 e-Portfolio Project #3
November 5, 2005