Hurricane Charley: Small but Furious
|
SATELLITE IMAGE OF HURRICANE CHARLEY |
|
|
|
Hurricane Charley at 1845Z on August 13, 2004, about one hour before landfall . Image courtesy of NOAA Satellite and Information Service, NESDIS Environmental Visualization Program. http://www.nnvl.noaa.gov/cgi-bin/index.cgi?page=items&ser=107987 |
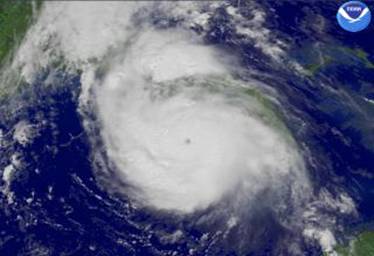
Hurricane Charley was the first of the four intense hurricanes to strike the coast of Florida in the summer of 2004. Charley was small in stature, but very determined, as she strengthened and accelerated prior to each landfall. She was born from a tropical wave off the western coast of Africa on August 4th, and made her Barbados before being named as Tropical Depression Charley on August 9th, when she moved into the southeastern Caribbean Sea. She was named a Tropical Storm on August 10th, and became a hurricane on August 11th as she approached Jamaica. She passed Jamaica and the Cayman Islands with her sites set on Cuba on August 12th.
Hurricane Charley left western Cuba as a Category 2 hurricane in the wee hours of August 13, 2004, and headed into the Gulf of Mexico toward Florida, right behind Hurricane Bonnie. But in the short span of water between Cuba and the western Florida coastline, Charley spun herself into a fury, climbing two categories in roughly 12 hours (from a Category 2 to Category 4). It remains a mystery to meteorologists how some storms tap into this rapid intensification cycle while others do not.
|
Hurricane Charley made landfall five times during its lifetime. |
||||
| 1st Landfall | 13Aug | 0430 UTC | 105 kts/120 mph | Playa del Cajio, Cuba |
| 2nd Landfall | 13Aug | 1200 UTC | 95 kts/109 mph | Dry Tortugas Island |
| 3rd Landfall | 13Aug | 1945 UTC | 130 kts/149 mph | Cayo Costa, FL |
| 4th Landfall | 14Aug | 1400 UTC | 70 kts/80 mph | Cape Romain, SC |
| 5th Landfall | 14Aug | 1600 UTC | 65 kts/74 mph | N. Myrtle Beach, SC |
The interesting thing about the Cuban landfall is that, according to the Tropical Cyclone Report-Hurricane Charley-9-14 August 2004, surface observations from Cuba (page 2) indicate that the maximum winds were about 105 kt as it crossed the island.” This would make Charley a Category 3 hurricane, yet the official track from the CIMSS site shows Charley as a Category 2 over Cuba.
|
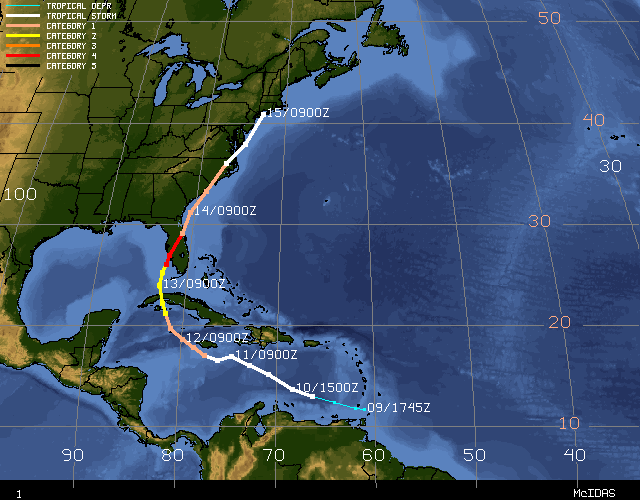
TRACK OF HURRICANE CHARLEY |
 |
|
Track of Hurricane Charley, courtesy of CIMSS Tropical Storm Archives http://cimss.ssec.wisc.edu/tropic/archive/2004/storms/charley/charley.html |
August 12, 2004
August 12th is the day Charley churned through the Caribbean toward Cuba. On this day she began her pattern of strengthening before landfall. The National Hurricane Center's Discussion for 11:00 AM EDT on August 12th states that there is an abundance of warmer water ahead, which acts as fuel for a developing hurricane (look at the little box to the right with all the orange in the vicinity of the hurricane - the orange is the warmer water). Also on the same image is a chart (big one on the left) that shows colored wind barbs - these represent the surface winds blowing counter-clockwise around her center. Note the colors - the orange around the center are 50-55 knot winds (57-63 mph - a Tropical Storm). However, there was heavy rain around the inner eyewall, which is shown by the red barbs as flags (it means their readings are unreliable due to the weak signal being returned).
I should stop to explain the charts I referenced in the paragraph above. The warmer water chart shows sea surface temperatures (SST), and the image chart is a Scatterometer reading of surface wind speed and direction. The Scatterometer is a radar system based on a satellite that assesses wind strength (speed and direction) from radar waves bouncing off the sea surface. Rougher seas indicate faster winds, and there's a scale of wave types to determine wind speed. The Scatterometer is a remote sensor, which is necessary for storms out of range of the Hurricane Hunters reconnaissance flights (eastern Atlantic Ocean).
The SST and Scatterometer charts referenced above are for 6:47 AM EDT on August 12th, and here's one for 13 hours later, which is 5 hours prior to the landfall in Cuba. Notice on this one that the center of circulation has moved just offshore of Cuba's southern coastline. The colored wind barbs are about the same, but you can see from the SST chart that she's now in the warmer waters favorable for strengthening. Since she was named a Category 1 hurricane by this time, we know that the unreliable wind barb data was indeed a low estimate, as Category 1 hurricanes must have winds of at least 74 mph on the Saffir-Simpson Scale to be considered as such.
For fun, let's look at a different wind analysis. This one is called an experimental wind analysis from the Hurricane Research Division which takes into account measurements from various sources to compile a color chart. Readings are taken from satellites, ships, buoys, reconnaissance flights, offshore weather station towers, and dropsondes to come up with the most reasonable compromise reading. On this (below top) you can see the eye in dark blue and a nice green and yellow core to its northeast indicating 70 knot (80 mph) winds, which makes it a Category 1. The numbered lines are marked at every 5 knots, and the colors indicate warmer temperatures as they flow toward the red end of the spectrum. This one is valid at 9:30 AM EDT on August 12th, three hours after the first wind-barb image above. The one below it is valid at 7:30 PM EDT, 45 minutes before the second wind-barb image above. Notice the difference! Check out the orange 'eyes' around her eye! The marked lines show that those orange circles are packing 80 knot (92 mph) winds - that's a strong Category 1 hurricane at this point. (By the way, those things that look like whales and debris floating by are actually the Caribbean Islands, so we can see her location on these images, too).
 |
|
HRD Maximum 1-Minute Sustained Surface Winds (kt) for Marine Exposure - Hurricane Charley 1330 UTC 12 Aug 2004. Image courtesy of http://www.aoml.noaa.gov/hrd/Storm_pages/charley2004/wind.html |
 |
|
HRD Maximum 1-Minute Sustained Surface Winds (kt) for Marine Exposure - Hurricane Charley 2230 UTC 12 Aug 2004. Image courtesy of http://www.aoml.noaa.gov/hrd/Storm_pages/charley2004/wind.html |
Hurricane Hunter's Coded Messages
The above tools come from the NOAA Reconnaissance flights. We also have information that comes to us from the Air Force Reconnaissance flights, called Vortex Coded Messages. These are a listing of text and numbers that show us various readings of flight level, air temperature, dewpoint, wind speed and direction, air pressure, location, surface wind speed and direction, and eyewall structure. I'll explain decoding these messages in a bit. The data in these messages is collected by the reconnaissance flights as they make 2 passes through the eyewall and through each quadrant of a tropical cyclone. They only cover the Gulf of Mexico, Caribbean Sea, mid-Atlantic Ocean, and central Pacific Ocean (if Hawaii is at possible risk).
This Vortex for 0941Z (which is Greenwich Mean Time for 5:41 AM EDT) shows us that it was too dark or rainy to get many of the readings (the NAs), and they took an educated guess at the pressure (EXTRAP 995 MB). This was one hour prior to the wind barb image above. This next set of Vortex Messages are for one and two hours after the wind barb image above, and the last one is one and a half hours before the HRD charts pictured above. On these we can see a 4 degree Celsius difference in the temperature outside the eyewall (9 C - I. on the 12/1123Z message) and the inside of the eyewall (13 C - J. on the same message), then at 12/1154Z a 9 degree Celsius difference (10 C and 19 C). This means that the eyewall was strengthening, because (without getting too technical) they heat up in the center and the heat is an indication of their strength. This matches the yellow circle on the first HRD chart above (1123Z) and the orange circles on the second HRD chart (1154Z). And the stronger the eyewall, the faster its winds around the eye, which also corresponds to the wind barb images mentioned earlier.
Now, for a decoding -- below is the Vortex Message for 10 minutes before the second wind barb image shown earlier (and a half hour after the second HRD chart above). But first some comments: we now see a 6 degree Celsius difference in the temperature inside and outside the eyewall - why did it go down? Look at the last letter, P. It says something about a double eyewall feature. A hurricane weakens a bit when it goes through an eyewall replacement cycle (this is just a restructuring of its inner core - this would be a whole different research topic). This is what happened to weaken Hurricane Katrina from a Category 5 to a Category 4 just before she struck the Louisiana coastline.
Now back to the decoding. Here is the Vortex Data Message for 5:07 PM August 12th.
| 830 URNT12 KNHC 122307 VORTEX DATA MESSAGE |
|
| A. 12/2307Z | Date and Time of center location for reading |
| B. 21 DEG 28 MIN N 82 DEG 10 MIN W |
Latitude and Longitude (geographical location) |
| C. 700 MB 2890 M | Flight level pressure and height (where plane is located) |
| D. 65 KT | Estimated maximum surface wind speed in knots |
| E. 042 DEG 027 NM | Bearing of max est surface wind from center of storm |
| F. 120 DEG 95 KT | Max flight level wind on last flight in the eye |
| G. 021 DEG 009 NM | Bearing of max flight level wind from center of storm |
| H. 976 MB | Minimum Sea Level Pressure (measured or extrapolated) |
| I. 12 C/ 3079 M | Max flight level temp and pressure altitude outside eye |
| J. 18 C/ 3074 M | Max flight level temp and pressure altitude inside eye |
| K. 8 C/ NA | Flight meteorologist's notes (Open eyewall to South-Southeast) |
| M. C15 | |
| N. 12345/7 | |
| O. 0.1/ 2 NM | |
| P. AF984 0703A CHARLEY OB 21 | Flight
meteorologist's remarks: MAX FL WIND 95 KT NE QUAD 2304Z. EYE HAS BECOME MORE CIRCULAR BUT STILL OPEN SSE... COMPRISED OF TWO MAIN BANDS WHICH OVERLAP CREATING DBL EYEWALL FEATURE, NNW THRU E.
* Note maximum flight level winds during recon was 95 knots in the NE quadrant at 2304Z (5:04 PM EDT). |
That's a lot to digest, but it's nice to know what all the coding means. These Vortex Messages also show us the gradual lowering of the pressure reading as well as the steady climb in wind speed. Charley did indeed strengthen before landfall!
Charley's Future
I'd like to close with a radar image of Charley around landfall at Punta Gorda, FL, and note that the people on the western Florida coast were preparing for a Category 2 hurricane, and were caught somewhat unpleasantly by surprise at its rapid strengthening just before landfall. The difference between a Category 2 and a Category 4 hurricane is substantial in damage, and the extent of damage from Charley was evidence of this surprise (you can find Casualty and Damage Statistics for Charley on pages 4-5 of the Tropical Cyclone Report ). Charley's damage made it the 2nd costliest hurricane since recordkeeping began in the mid-1800s, with Hurricane Andrew in 1992 being the costliest (note that this statistic is expected to change when all damage estimates from Hurricane Katrina are completed).
|
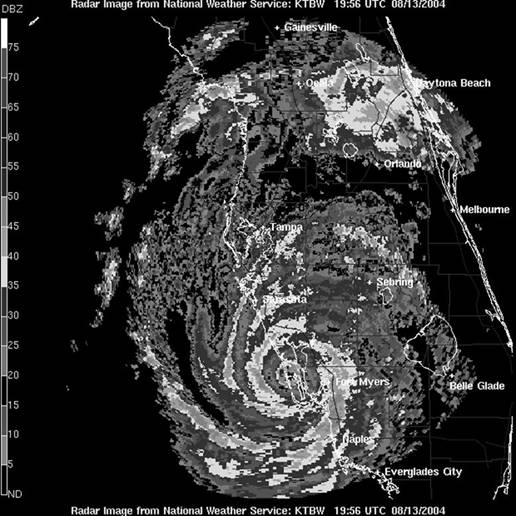
RADAR IMAGE OF HURRICANE CHARLEY |
 |
|
Radar image of Hurricane Charley just after landfall. Image courtesy of The National Weather Service Tropical Cyclone Report – Hurricane Charley – 9-14 August 2004 by Richard J. Pasch, Daniel P. Brown, and Eric S. Blake, National Hurricane Center, 18 October 2004, Revised 5 January 2005. http://www.nhc.noaa.gov/2004charley.shtml? |
Debbie Jarvis-Ferguson
Meteo 241 - Assignment #1
Penn State University
September 23, 2005