Mesoscale Discussion #109
Freezing Rain in Maine
Introduction
Our first assignment here in Meteo 361 is to pick a Mesoscale
Discussion (MD) and break down its components into understandable language with
explanatory graphics, in effect a dissection for the layman to understand what
some of the tools look like and what some of the terms mean. I chose an MD
that focused on winter precipitation, snow changing over to freezing rain, as
part of a mid-latitude low pressure system moving over Caribou, Maine. The
reason I chose this MD was 1) it was recent and I could gather more pertinent
backup images to support the MD, and 2) I wanted to try to illustrate a freezing
rain event in order to better understand how this profile sets up in the
atmosphere and how it looks on the various data tools - I needed practice on how
to read these tools.
Also, Maine is one of the places of interest to me because it's part of the center of the fishing industry for New England, along with Massachusetts (I reference here The Perfect Storm, (book and movie) based in part in Worcester, Massachusetts and aboard the Andrea Gail swordfishing longliner). Maine also has a number of lighthouses (68 by my count on this website http://www.lighthouse.cc/me.html). I'm drawn to the entire culture of the fisherman and the cold, northern seas and Nor'easters as much as I'm drawn to Galveston and the Gulf of Mexico. Lately I've been drawn to stories about the Alaskan fishing industry, but that's another weather system climate to study later.
Mesoscale Discussions
Since our focus is on a Mesoscale Discussion, we should probably have a little
information about what they are.
Mesoscale Discussions are extremely informative narratives that are issued
when forecasters see conditions coming together that could warrant severe
weather of some sort, such as severe thunderstorms, heavy rain and/or flooding,
tornadoes, and also winter storm conditions. Even dry conditions that
warrant fire-alert situations are covered in these discussions. These
discussions cover from 1-3 and up to 6 hours, and zero in on a specific area, which is why they are termed "mesoscale."
["Synoptic scale" would encompass a longer time period and greater geographic
region.] The forecaster notes the time and date, notes the areas affected, and titles the discussion for the type of weather
he's observing, then delves into the specifics of the various forces and
conditions which are leading to the predicted severe weather threat. In
these discussions, the forecaster references various tools used to identify
current and forecast conditions, which can be confusing to read when you're not
familiar with them. For more information on how forecasters use these
discussions to "plan their day," see the link to the
Storm
Prediction Center.
Mesoscale Discussion #109
On February 3, 2006, Forecaster Guyer saw the changeover from
snow to freezing rain for northern Maine. At 1:30 pm EST in the afternoon,
he issued
MD #109
[found at
http://www.spc.noaa.gov/products/md/md0109.html] indicating winter mixed
precipitation for northern Maine.
Here is the accompanying graphic and the first paragraph of the MD:
MESOSCALE DISCUSSION 0109
NWS STORM PREDICTION CENTER NORMAN OK
1220 PM CST FRI FEB 03 2006
..GUYER.. 02/03/2006
AREAS AFFECTED...NORTHERN ME
CONCERNING...WINTER MIXED PRECIPITATION
VALID 031820Z - 032215Z
AFTER INITIAL SNOW...A SEVERAL HOUR WINDOW OF PREDOMINANT FREEZING
RAIN IS LIKELY THIS AFTERNOON ACROSS NORTHERN MAINE. HOURLY LIQUID
EQUIVALENTS OF 0.05-0.10 INCH OR GREATER APPEARS LIKELY...WITH SOME
ICE ACCUMULATION EXPECTED.
Notice that turquoise line with the 32 on it and the "18Z Wet Bulb temps" beside it. That line indicates the temperature (32ºF or 0ºC) reached by air that has water evaporating into it at a constant pressure. Though this looks like it's indicating a line where freezing precipitation takes over from liquid precipitation, it's not sufficient to show a freezing rain setup. What we're interested in is the pink circled area where the focus of the MD will be centered.
Surface Analysis and Water
Vapor Satellite Imagery
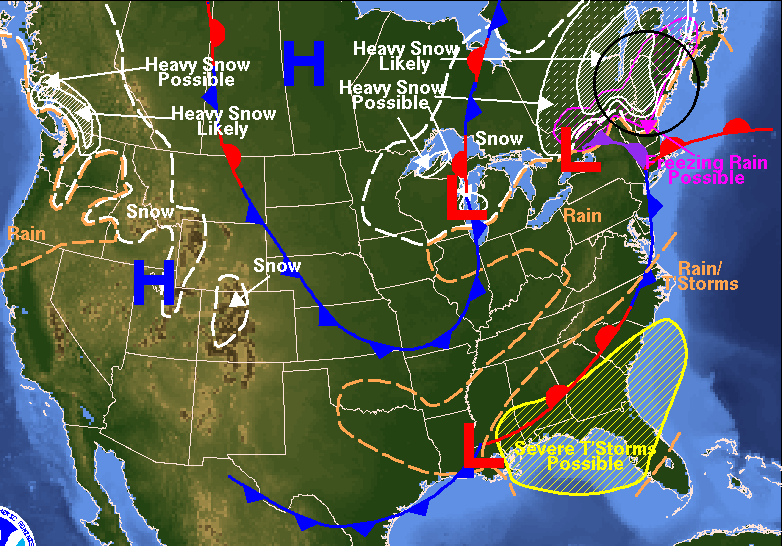
In the table below is the Surface
Analysis forecast map for the day of February 3, 2006. Notice that it
shows Freezing Rain Possible with an arrow pointing toward Maine (the area in
question is circled). This area lies on the warm front side (red barbed
line) of an occluding low pressure system (purple barbed line), which usually
indicates heavier precipitation and a gradient from liquid to freezing
precipitation. Low pressure systems have this classic comma setup when
they are maturing.
 |
|
This Surface Analysis Forecast map for February 3, 2006 shows the Freezing Rain Possible zone, with the area in question, Maine, in the circle. Image courtesy of the DOC/NOAA/NWS/NCEP/ Hydrometeorological Prediction Center at http://www.hpc.ncep.noaa.gov/noaa/noaa.gif. |
Now for the rest of the Mesoscale Discussion (shown in all caps).
WATER VAPOR IMAGERY/SURFACE ANALYSIS DEPICTS SHORTWAVE TROUGH AND ATTENDANT 997 MB SURFACE LOW INVOF LAKE ONTARIO...
Forecaster Guyer starts out with a reference to the water vapor imagery and surface analysis that show the shortwave trough (trough of low pressure) and the surface low. The low can be seen on the Surface Analysis map above, and the short-wave trough can be seen on the image below (below the water vapor and radar images). "INVOF" means "in the vicinity of." On the water vapor imagery below, you can see the classic comma shaped feature of the low pressure system over the Eastern Seaboard, and how it follows the lines of the low drawn on the Surface Analysis above. The 997 mb surface low pressure system can be seen on the 500 mb Sea Level Pressure image below (under the 500 mb Geopotential Heights image) for 18Z on February 3 2006.
 |
|
This satellite image shows the water vapor signature at 1915Z (2:15 pm EST) on February 3, 2006. I've drawn a line to illustrate the classic comma shape of the occluding front. The front follows the shortwave trough. This image courtesy of the Penn State e-wall. |
Precipitation Shield and Snow on the Skew-T
WITH BROAD PRECIPITATION SHIELD /TIED TO STRONG FORCING FOR
ASCENT/ SPREADING ACROSS MUCH OF SOUTHERN NEW ENGLAND.
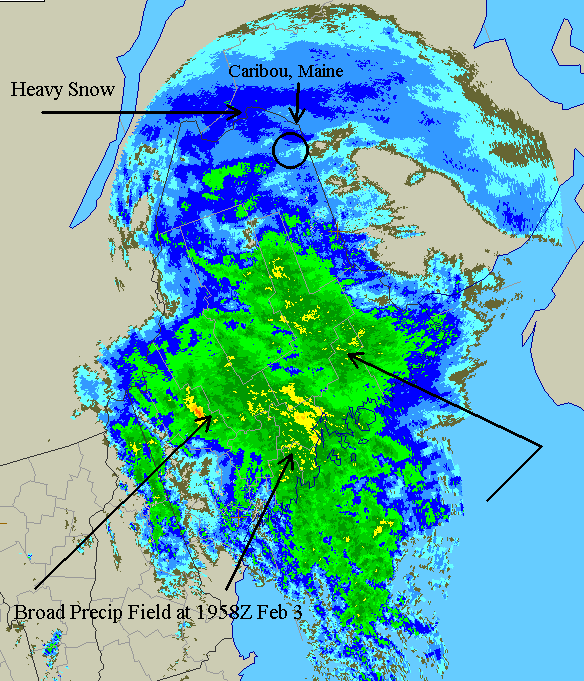
In the table below, under the Omega image, I've attached a radar image from 1958Z (2:58 pm EST) on February 3, 2006, which illustrates the broad precipitation field moving up through the state of Maine. Note the snow in the northern part of the state, with Caribou falling within the moderate blue coloring. The strong force for ascent is referring to a lifting mechanism causing air to rise, most likely convection (moist, rising air forming clouds). The table just below is a 700 mb Omega image for February 3, 2006, which shows the vertical motion in the atmosphere surrounding the low pressure center. The dashed lines with negative numbers indicate the rate of rising air/convection occurring. Note that sinking air is denoted by positive numbers surrounding the centers of high pressure areas. These negative and positive numbers indicate changes in pressure (negative = lowering and positive = rising).
 |
|
This 700 mb Omega image for February 3, 2006 shows the vertical motion in the atmosphere surrounding the low pressure center. The dashed lines with negative numbers indicate the rate of rising air/convection occurring. Note that sinking air is denoted by positive numbers surrounding the centers of high pressure areas. This image courtesy of the NCEP/NCAR site at http://www.cdc.noaa.gov/cgi-bin/Composites/. |
In this case, the lifting mechanism is most likely strong upper-level divergence associated with the short-wave trough mentioned in the previous sentence. This can be seen in the 500 mb Geopotential Height image for 18Z (1:00 pm EST) February 3, 2006, shown below the radar composite image. Mass divergence occurs to the east of a 500 mb short-wave trough.
 |
|
This radar image from the UCAR archives shows the broad precip field heading across Maine at 1958Z (2:58 pm EST) February 3, 2006. The heavy snow is depicted in dark blue in the northern part of the state. Caribou, Maine is circled. At this time, Caribou was experiencing moderate snow. Image courtesy of the UCAR site at http://www.rap.ucar.edu/weather/radar/displayRad.php?icao=KCBW&prod=n0r&bkgr=black&endDate=20060203&endTime=20&duration=0. |
500 mb Geopotential Heights and Surface Level Pressure Charts
 |
|
This image shows the Geopotential Heights at 500 mb, or the middle troposphere. The short-wave trough and area of mass divergence which occurs east of a 500 mb short-wave trough are both marked. Low pressure systems form on the right upward side of a "dip" in the heights. This image courtesy of NCEP/NCAR at http://www.cdc.noaa.gov/cgi-bin/Composites/. |
|
|
|
This image shows the Sea Level Pressure at 500 mb, and you can see the 997 mb low pressure system referenced by Forecaster Guyer. Note the location of the low's center as compared with the trough on the Geopotential Heights image above. This image is courtesy of the NCEP/NCAR site at http://www.cdc.noaa.gov/cgi-bin/Composites/. |
As you can see by a comparison of the two images above, the 997 mb low pressure system formed to the east of the 500 mb short-wave trough in the area of mass divergence.
Snow and the Encroaching Warm Layer
To continue with the MD:
ALTHOUGH INITIAL PRECIP TYPE ACROSS NORTHERN MAINE WILL BE IN
FORM OF SNOW...ENCROACHING MID
LEVEL WARM LAYER WILL SUPPORT SEVERAL HOURS OF FREEZING RAIN AMIDST
STRONG WAA PROFILES AS SEEN IN 12Z RAOBS AND REGIONAL WSR-88D VWPS.
Precipitation started out as snow, as can be seen on the
Skew-T RAOB image in the table below. [The way you tell is a) precip = both temp and dewpoint lines together, b) both lines are below the 0ºC
temperature line, c) the temp line heading to the right indicates the warm layer,
and d) the flags on the right = winds which point in one direction then change
to another as they go up - the lower flags blowing from the SE show the WAA, or
warm air advection, which is the warm air that will overrun the cold air.]
However, the warm front was moving in and Forecaster Guyer knew the warm
air would overrun the cold air, leaving the bottom layer of the atmosphere cold
with a wedge of warm air between it and the cold upper level air. When
this happened, as stated above, the snow would melt in the warm layer.
Since the warm layer was taking up quite a bit of space in the middle
atmosphere, it would leave only a small layer of cold air at the surface,
meaning that the rain would not refreeze into sleet but would freeze on contact
with the ground and surrounding objects. Hence, freezing rain. [If
you like, take a look at this Skew-T loop from before the snow began to the end
of the freezing rain -
Caribou Skew-T - you can see how the temperature and dew point lines both
moved up next to the 0ºC (32ºF) temperature line.]
The "REGIONAL WSR-88D VWPS" is a radar plot wind profile which shows the change
in winds with time and height.
 |
|
This image is the Skew-T RAOB from 12Z (7:00 am EST) February 3, 2006 shows the precipitation occurring, the warm layer or inversion, and the wind shear (change in speed and/or direction of wind with altitude). Image courtesy of University of Wyoming at http://weather.uwyo.edu/upperair/sounding.html. |
The best way to show the "encroaching mid level warm layer" is to present the temperature profile (in the table below) for the atmosphere from the surface to the upper levels, which indicates the "slosh line", which is the 0ºC (32ºF) isotherm that marks the area where melting may occur and thus mixed types of freezing precipitation are possible. The yellow line is the "slosh line", which, on the image below, marks the area around the 0°C isotherm where the isotherm would most likely be located (this is a forecast for future conditions, so there is a level of uncertainty as to exact location). The boxes are stacked by altitude (shown in millibars, which mark standard heights in the atmosphere), with the three columns representing three different models (ETA (or NAM-North American Mesoscale), AVN (Aviation MRF-Medium Range Forecast, nka GFS-Global Forecast System), and NGM (Nested Grid Model). The bottom two boxes show the surface (2 meters), with the stack of boxes indicating altitudes of 2 meters up to approximately 2000 meters (6 feet to roughly 6500 feet or 1.25 miles). This is valid at 18Z (1:00 pm EST) on February 3, 2006.
 |
|
The 18Z (1:00 pm EST) February 3, 2006 temperature profile prog from the Penn State e-wall. The boxes are stacked by altitude, with the surface (2m) at the bottom, and the three columns represent three different models. The yellow line is the "slosh line" or 0°C isotherm indicating the area where melting may occur. The bottom right box shows the yellow extending into northern Maine at the surface. All of the other boxes indicate a profile for snow. |
For freezing rain to occur, there has to be a fairly thick warm layer of air in the mid-upper atmosphere extending down just above the surface, with a cold layer of air at the surface. Snowflakes (all precipitation starts out in the top of the clouds as snowflakes) move through this warm layer, melt into rain, then move through the cold surface layer and freeze on contact with the ground and surrounding objects. This profile is setting up in northern Maine, as shown by the "slosh line." Note that the bottom right box (2 meter AVN) shows the yellow "slosh" line extending into northern Maine at the surface.
Freezing Rain Between 20Z-22Z
And the final lines of the MD:
LATEST RUC/NAM FORECAST SOUNDINGS AND SREF CONSENSUS SUGGESTS
A
GENERAL TRANSITION TO PREDOMINANT FREEZING RAIN BETWEEN 20Z-22Z
ACROSS NORTHERN MAINE...ESPECIALLY N/NW OF A MILLINOCKET TO PRESQUE
ISLE AXIS.
The RUC/NAM (Rapid Update Cycle/North American Model) Forecast Soundings and the SREF
(Short Range Ensemble Forecasting) consensus were based on prog (prognostication
models)
loops that took various elements of the atmosphere through a time loop to
indicate possible conditions based on current data. The RUC/NAM is a loop
of nowcasting images used for very short-term forecasts, and the Ensemble is
comprised of a number of models in comparison. What Forecaster Guyer is
saying is that these models all gave the indication of the warm wedge layer
setting up for a freezing rain profile. When the models agree and end up
being correct, the forecast is said to verify. This forecast verified as evidenced
on the meteogram in the table below. I've circled the line showing
precipitation type which shows the symbol for snow changing over to the symbol
for freezing rain at 22Z February 3 (4:00 pm EST) until 00Z February 4 (7:00 pm
EST).
 |
|
This meteogram gives abundant information on actual conditions between 1654Z (11:54 am EST) on February 3 and 1654Z (11:54 am EST). Some of the information shown is for temperature, dew point, pressure, cloud cover, wind speed and direction, and time of and type of precipitation. I've circled the precipitation from 19Z February 3 (2:00 pm EST) to 01Z February 4 (8:00 pm EST February 3), which shows heavy snow becoming moderate snow at 20Z, then turning over to freezing rain from 22Z-00Z, with rain at 01Z, then precipitation ends until a bit of sleet at 06Z (1:00 am February 4). Image courtesy of the University of Wyoming at http://weather.uwyo.edu/cgi-bin/wyowx.fcgi?TYPE=sfgram&DATE=current&HOUR=current&UNITS=A&STATION=CAR. |
Notice how the pink temperature line and the green dew point line are so close together in the first box. This is an indicator of the atmosphere being favorable to precipitation, as relative humidity is high, meaning the air is fairly well saturated. Saturated air usually means precipitation if there is a relatively deep layer of it, which cannot be discerned from a meteogram, as this shows surface readings only. However, the two moderate snow symbols at 19Z-20Z correspond with the radar image from the UCAR site above. The numbers beside the gray GUST are wind gusts, which were occurring during the precipitation event from 19Z February 3 to 00Z February 4.
Conclusion
The conclusion here is that the actual conditions occurred as Forecaster
Guyer had predicted, even though the freezing rain event lasted only about three
hours. He saw the signs, as it were, on the various tools available that
gauge the atmosphere's many variables and models possible conditions given
current data. There are times, however, when the atmosphere introduces
unexpected variables or changes too quickly for a forecast to "make." In
researching these instances, or "busts," forecasters learn about new variables and patterns
and are able to apply them when similar situations occur in the future.
Weather is a never-ending mystery, even with all of these tools. And
that's what makes weather so exciting!
Reflections
Most of what I learned from this exercise was a healthy respect for archives!
I started out on this assignment with the thought of researching a storm further
back that I had personally experienced. Since I did manage to find some
things for it, I hope to be able to use them later, perhaps in another project.
But what I learned about that "personal" storm was interesting in and of itself.
When I decided to switch to a more recent event, data was more readily
accessible, and it has made for a better piece.
What made this more interesting was the ability to "see" the narrative in the MD come alive through radars and other types of charts and data. And that, in turn, helped to make more sense out of the narrative than it did just reading it through. It also helped me to become more comfortable with information and data sources and resources. This is something that will be the key to forecasting and/or research in the future. However, I've bookmarked so many sites into Favorites that I have overwhelmed myself when I try to find certain information!
The last reflection on what I learned is that I have finally become more comfortable with setting up a document of this type and saving the files correctly. We had a break of a month between the last class and this one, but I found that I thought I remembered how to put everything together much easier than I had before. I still have work to do in this area, but the usual panic didn't set in.
I'd have to say, all in all, this assignment was extremely rewarding.
Debbie Jarvis-Ferguson
February 10, 2006