 |
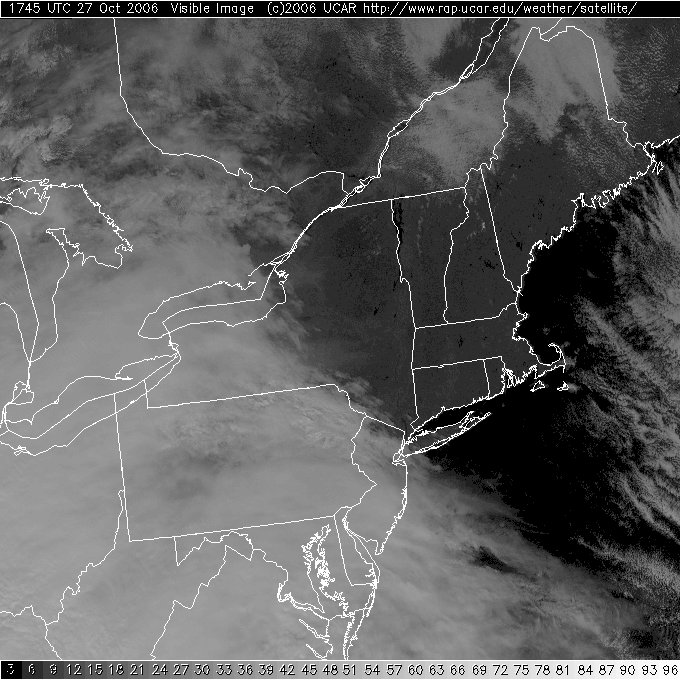
| This visible satellite image from the RAP-NCAR site shows the persistent thin, opaque low cloud layer over Caribou at 1745Z on 10/27. |
Caribou, ME KCAR
Forecasting Weeks of October 23-28 and October 30-November 4
Caribou, ME is a city in the most northeastern part of the state of Maine, almost in Canada. It sits far enough inland (150 miles from the Atlantic) so as not to be affected by ocean breezes and maritime moisture. It's elevation of 625 ft. is about the same as the hills that surround it. Normally warm days and cool nights give way to the passing frontal boundaries and low pressure systems that bring large temperature gradients and higher winds, as well as good precipitation chances. Clouds moving in quicker than anticipated ahead of a front and persistent clouds after the passage of a low pressure system turned out to be the bolts in the carburetor, providing fodder for both lessons learned.
Forecast week 1 for Caribou, ME KCAR - Week of October 23rd
Forecast Period 06Z 10/27/06 - 06Z 10/28/06
Our Lesson Learned for this week had to do with the MOS bust on high temperature the day after the passage of a cold front. This bust was due to a persistent thin, opaque layer of low clouds. These clouds can be seen on the visible satellite image below, valid at 1745Z on 10/27.
|
|
| This visible satellite image from the RAP-NCAR site shows the persistent thin, opaque low cloud layer over Caribou at 1745Z on 10/27. |
The passage of a low pressure system cold front occurred the day before, on Thursday 10/26, and brought clouds, northwest winds and cold air advection to Caribou. The meteogram for 0454Z 102606 - 0554Z 102706 shows the small temperature variance, overcast conditions and northwest winds through the forecast period. MOS (12Z 10/26) forecast the clouds to dissipate on Friday 10/27 in time for solar heating in the afternoon, but a thin, opaque layer of low clouds was persistent in hanging around through 22Z 10/27 (partly cloudy at 23Z 10/27 - 00Z 10/28, and then clearing at 01Z-06Z 10/28). The satellite image above shows the persistent cloud layer, and the meteogram below illustrates these conditions and shows the clearing beginning at 22Z.
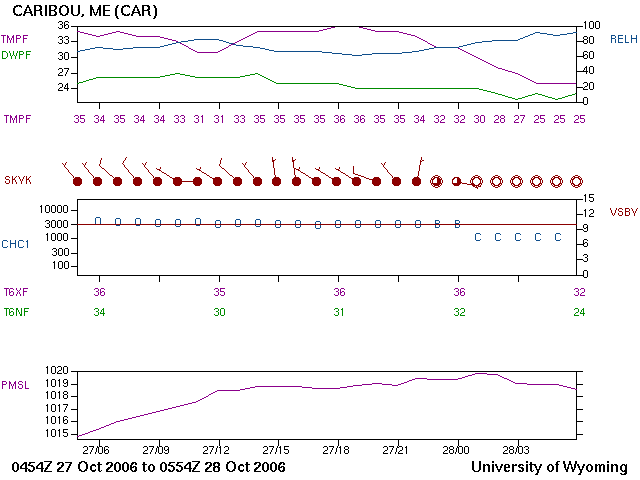 |
| This meteogram from the University of Wyoming Surface Observations site shows the persistent cloudy conditions through 22Z 10/27, partly cloudy conditions at 23Z 10/27 - 00Z 10/28, and calm winds and clear skies from 01Z-06Z 10/28. |
In my notes I wrote that the forecast progs mostly showed 30% RH (low relative humidity) at 700 mb (lower left panel, brown coloring), which is an indication of dry air moving in. Dry air is usually not conducive to clouds developing or remaining because of low moisture in the air to support them. MOS accounted for the clouds to clear in time on Friday for afternoon heating to raise the temperature into the 40s range. When the clouds finally started clearing at 22Z, the afternoon solar heating window had already passed. Clear skies and light winds allowed the temperature to cool several degrees cooler than MOS predicted for the overnight low temperature. Friday 10/27 temperatures were as follows:
| 06Z 102706-06Z 102806 | High | Low |
| Norm | 46 | 31 |
| GFS-MOS | 45 | 26 |
| ETA-MOS | 44 | 29 |
| GFS-MOS | 40 | 28 |
| Tabular | 41 | 30 |
| Area | 44 | 27 |
| Zone | mid 40s | upper 20s |
| AFD 7 Day | 43 | 27 |
| Actuals | 36 | 24 |
The clouds were the results of a low-level inversion over Caribou that would not break with the weak winds. Had the winds been stronger, mixing of warmer, drier air from the upper levels down to the surface could have broken the inversion more quickly, and thus dispersed the clouds. The Skew-T chart below, for 00Z 10/28, illustrates this situation. The surface inversion can be seen from 900 mb to approximately 875 mb in the right-hand black line that moves to the right with height. This indicates that temperatures are warming with height, rather than the usual cooling with height (inversion). Also note the winds at the surface are calm, with 5 knots in the lower levels - too weak to initiate mixing of the boundary layer with warmer, drier air from the upper levels.
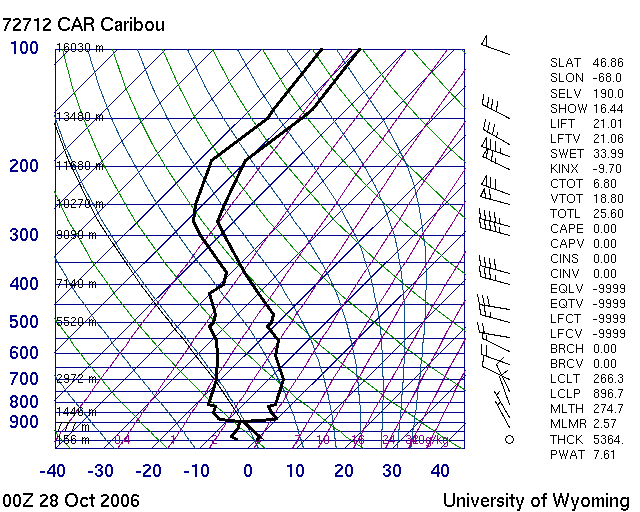 |
| This Skew-T/Log P diagram, for 00Z 10/28/06, shows the surface inversion at 900 mb to approximately 875 mb (the right-hand black line goes toward the right, indicating temperatures get warmer with height, rather than the usual cooler with height. Thus, the inversion. Note the winds are very light at the surface, from calm to 5 knots. Image courtesy of the University of Wyoming Upper Air Data site. |
Reflections
One of the basic things we learned in Meteo 101 was that where the temperature and dewpoint meet on a Skew-T/Lop P diagram, the relative humidity is high and clouds usually form. However, as with all things to do with Nature, these can't be hard and fast rules because Mother Nature breaks Her own rules whenever She feels like it. The relative humidity showed to be low, and the system's movement and pattern indicated it would take the clouds out with it when it exited the region. Instead, clouds persisted even with the low RH and the following high pressure system moving in.
Understanding the science behind how the atmosphere behaves is hard enough without instances such as this where science points to one probability and Nature does another. Even scientists get surprised by natural events and occurrences that by all indications should have had a different outcome. I once said, at the very beginning of the program, that the weather had a mind of its own and was akin to a personality - I was pretty much laughed at for that mindset, because it was science that I was about to learn which would explain it all. In hindsight, I think I get the last laugh because it appears that I was right - the weather has a mind of its own.
Forecast week 2 for Caribou, ME KCAR - Week of October 30th
Forecast Period 06Z 11/2 - 06Z 11/3
One of our Lessons Learned needed to address the use of the SREF Ensemble tool, which I chose to use for precipitation during this week. SREF ensembles can be found on the PSU eWall and the NCEP sites. The SREF ensemble represents the averaged consensus between all the models, and serve to deal with model uncertainty, such as differences between models and differences between run times for each model. They also provide a spread for the uncertain factors, allowing the forecaster to better see the discrepancies and determine a ballpark area of consensus. This can best be symbolized by a number of arrows hitting a target area, rather than a lone arrow trying to hit a bullseye.
For this forecast period, I chose to use the SREF ensemble forecasting tool because the predicted amounts of precipitation from my various sources were a bit disparate. The NGM and WRF progs from the 12Z run had precipitation close by at 18Z 11/2 - 00Z 11/3, but not directly over Caribou. The GFS and CMC progs, however, had the 0.01-0.10 chance over Caribou from 12Z-18Z 11/2. MOS indicated values of 40 (NGM at 18Z), 14 and 12 (ETA at 00Z-06Z 11/3), and 28-22-19 (GFS at 18Z-00Z-06Z respectively), indicating a high percentage of precipitation probability at those times. The Area forecast called for 0.01 at 06Z 11/2, and 0.15-0.34 from 12Z-18Z 11/2. The Point forecast had 0.26 at 18Z 11/2 and 0.03 by 06Z 11/3. These precipitation amounts represent the amount in the three hour period leading up to the Z time indicated.
 |
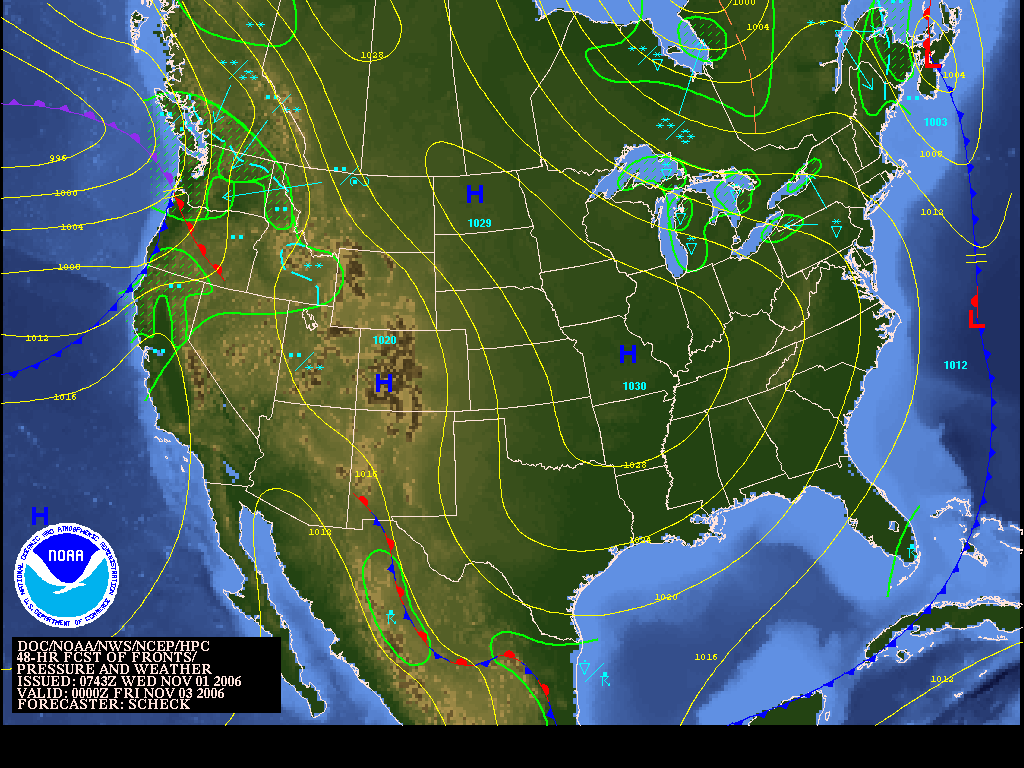 |
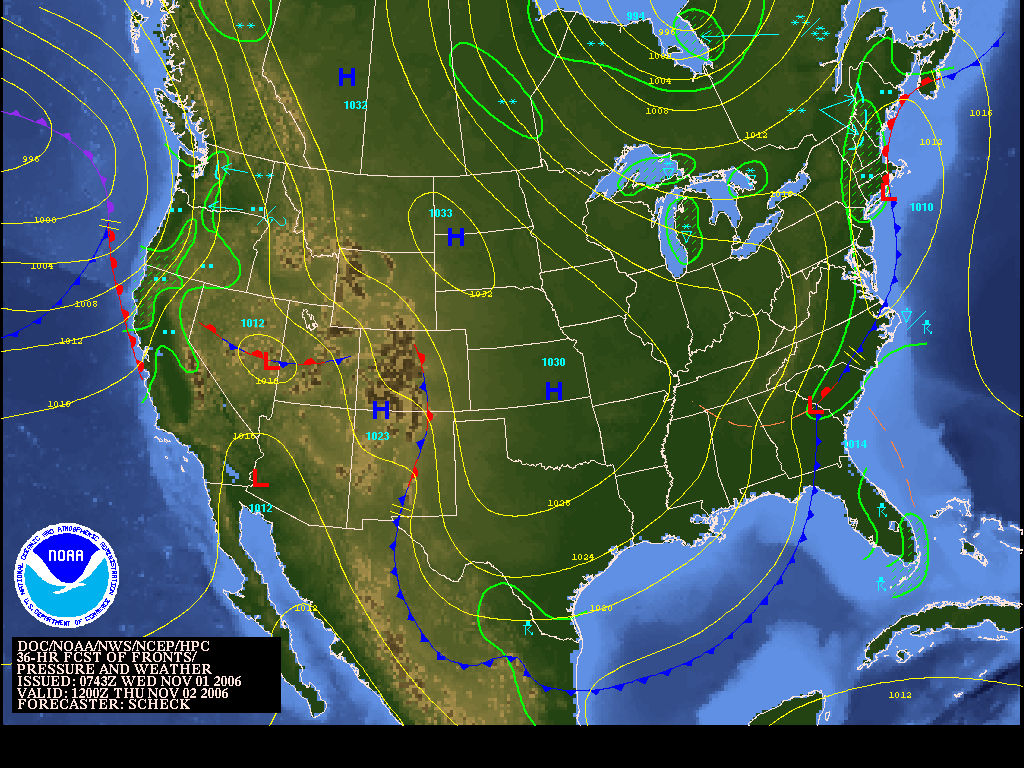
| This surface analysis map, valid at 12Z 11/2, shows the warm front offshore in the Gulf of Maine and rain chances drawn around the Caribou area. Image from the Hydrometeorological Prediction Center (HPC) site. Click on image for a larger view. | This surface analysis map, valid at 00Z 11/3, shows the low pressure system northeast of Maine, having moved north out of the Gulf of Alaska. Note the rain chances still drawn around the Caribou area. Image from the Hydrometeorological Prediction Center (HPC) site. Click on image for a larger view. |
The HPC front maps above for 36 hrs, valid 12Z 11/2, and 48 hrs, valid 00Z 11/3, show the rain chance over Caribou with the warm front offshore. The AFD from 11:17 am on 11/1 indicates this warm front was forecast to stall offshore, bringing the precipitation chances up into northern Maine. The Zone forecast from the Caribou NWS site called for a 60% chance of rain Thursday 11/2, with another 50% chance of rain and snow showers Thursday night. And finally, the Day 2 QPF map (below) from the HPC shows the chance of precipitation amounts from 0.10-0.50. The FOUS 12Z run indicated no precipitation amounts in the forecast period.
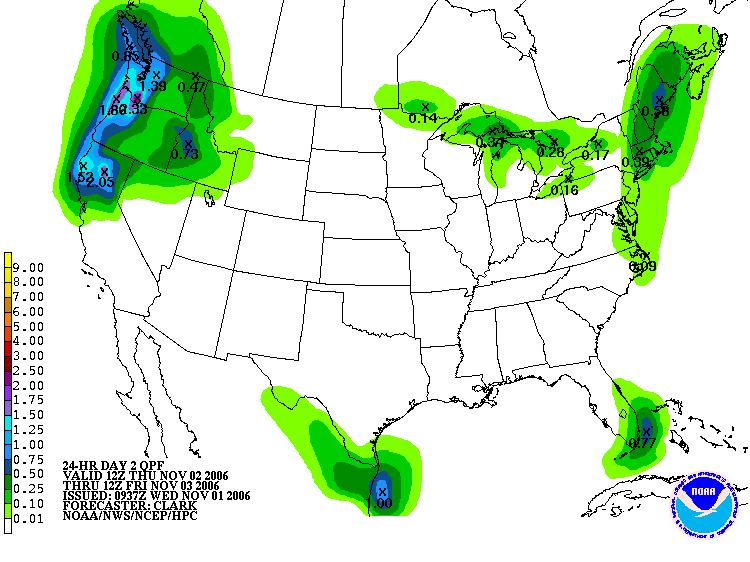 |
| This QPF forecast map (Quantitative Precipitation Forecast), valid from 12Z 11/2 through 12Z 11/3, shows the Caribou area in the borderline areas of 0.10-0.25 and 0.25-0.50 inches. This represents the total amount possible for the valid forecast period. Note that this period overlaps the contest forecast period by 6 hours at the end, and less the first 6 hours at the beginning. Image from the Hydrometeorological Prediction Center (HPC) site. |
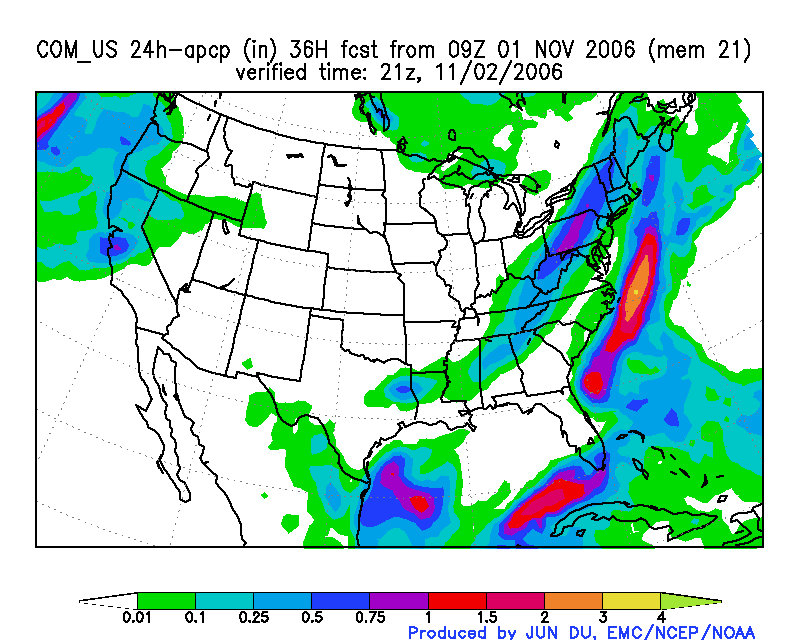
This disparity in rain chances and amounts led me to the 36 hr SREF, valid 21Z 11/2, and the 42 hr SREF, valid 03Z 11/3 (see table below). On the SREF ensemble images below for precipitation, the amount indicated was 0.10-0.25 on both ensembles.
 |
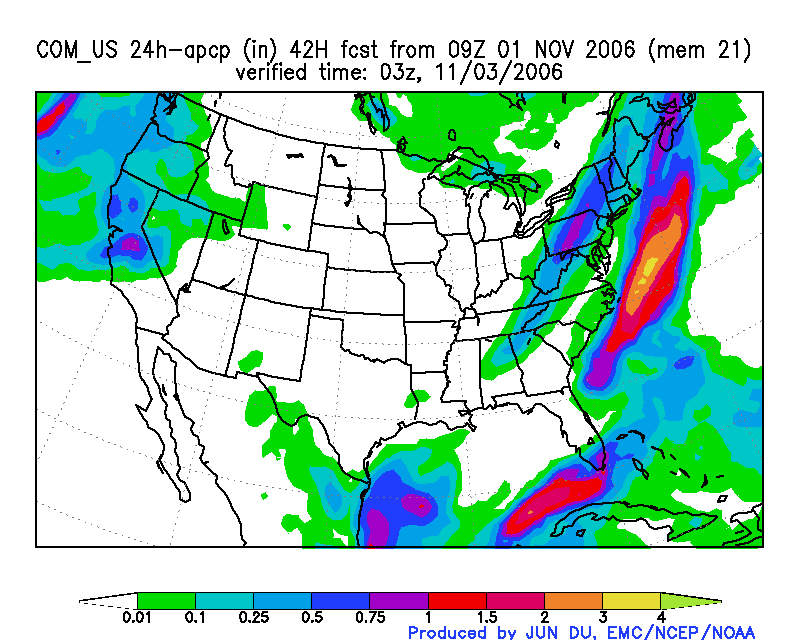 |
| This SREF ensemble forecast for precipitation, valid at 21Z 11/2, shows the model consensus average of 0.10-0.25 inches. Image from the NCEP Model Analyses and Forecasts site. Click on image for a larger view. | This SREF ensemble forecast for precipitation, valid at 03Z 11/3, shows the model consensus average of 0.10-0.25, but on the edge of change to 0.25-0.50 inches. Image from the NCEP Model Analyses and Forecasts site. Click on image for a larger view. |
I chose these maps because they overlap the forecast period (the left map is for 21Z 11/2 - 21Z 11/3, and the right map is for 03Z 11/3 - 03Z 11/4). Based on this information, I forecast for a precipitation amount of 0.10 inches. However, the actual precipitation amount for the forecast period, as recorded on the Climate Report, was for a trace. The meteogram below shows that the rain occurred in the six hour period between 06Z-12Z 11/2.
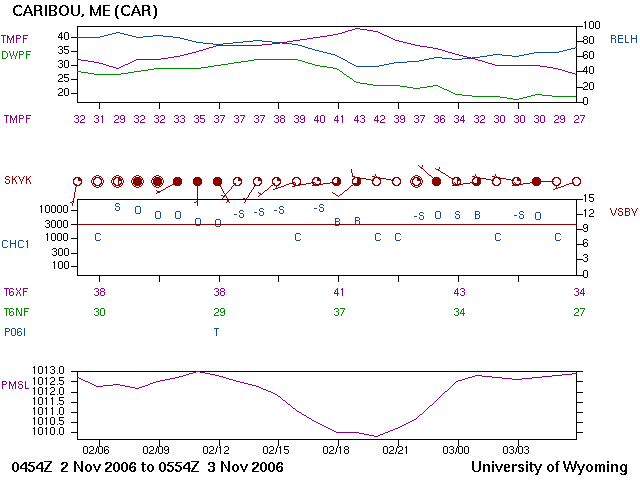 |
| This meteogram from the University of Wyoming Surface Observations site shows the trace of rain in the six hour period between 06Z-12Z 11/2/06, as indicated by the blue T above 02/13 in the P06I row. |
I've also linked to the METARS for the forecast period to show the trace precipitation occurred in the 3 hour period between 0754Z and 1054Z - the P0000 highlighted indicates precipitation, the zeros indicate a trace (measurable amount less than 0.01 inches).
Reflections
Precipitation prediction is a very tricky business, full of ifs and buts. It's almost like the same thing as with the clouds above - the science points to one probability and Nature does another. All indications on the models showed the probability of a measurable amount of rain to occur at Caribou in the forecast period, measurable meaning 0.01 inches or more. Even the SREF ensemble, a very useful tool that takes all the model probabilities and averages them into a consensus, pointed toward the probability of 0.01-0.25 inches. However, the atmosphere just didn't support it in Caribou. One could say that all of the arrows missed the target area. Model uncertainties begin with the initial conditions that are input, whose imperfections can escalate with each subsequent run. Though real observations are input, real observing stations are not consistently located to be able to give completely accurate data for every location. Thus, the models begin to have a domino effect of imperfect data. The ensembles try to pinpoint a consensus of accuracy among the models to get the target area, or spread, for the forecast.
However, I still have a lot to learn about using the ensembles, as I needed to find maps for the forecast period, and should have used additional SREF ensembles from the PSU eWall. Looking at a few more ensembles would have given me more comparison data and a better target area for consensus.
Looking back on the two weeks at Caribou, I'm left with a feeling of frustration. I could never quite become one with the atmosphere over that city, and it continued to surprise me every time I thought I understood it better. I find that low pressure cyclonic systems and frontal boundaries affect different areas of the country differently according to local climate, terrain, and proximity to bodies of water or mountains. Caribou was close to the Atlantic, I thought; however, it proved to be just west of hilly terrain and was basically cut off from ocean influences. I think when I made this precipitation forecast, I was still thinking along these lines in the back of my mind.