| |
| George R. Kasica
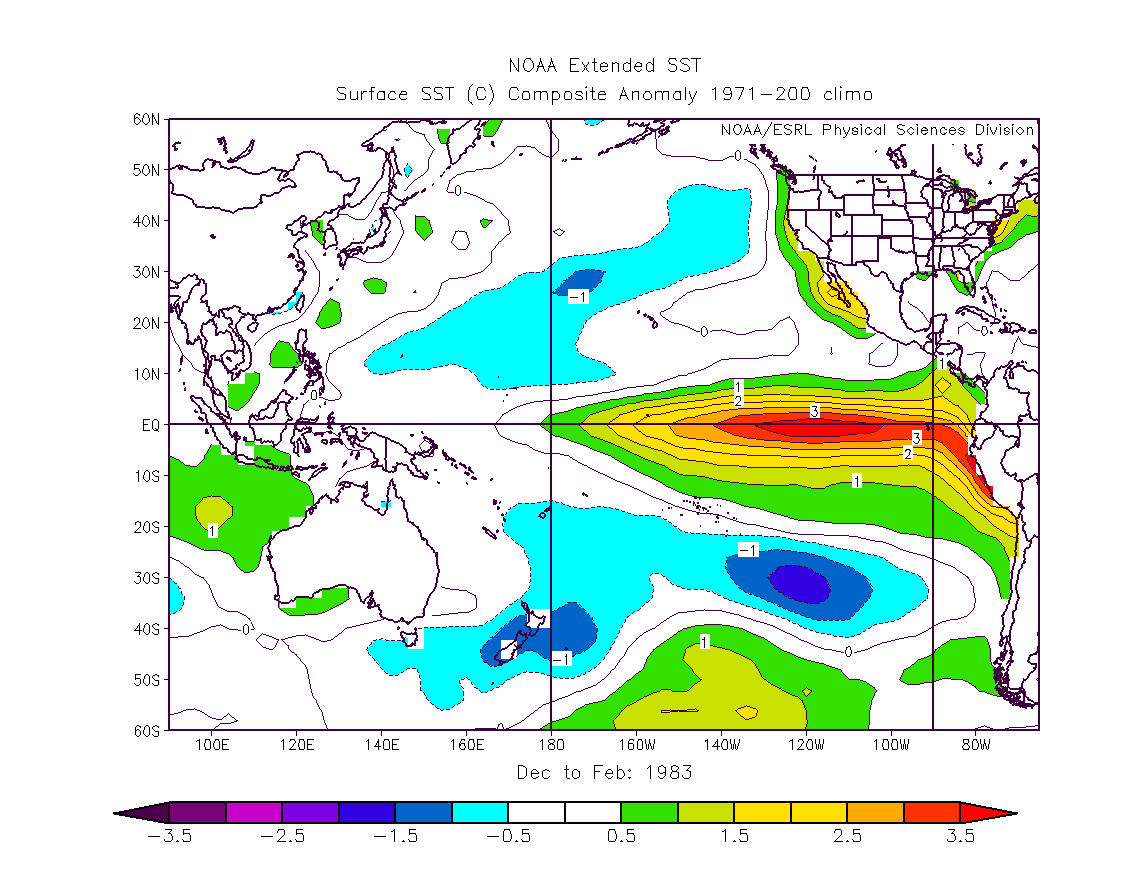
METEO 241 Portfolio #2: The 1982-83 El Nino and it's effect on sea surface temperatures in the eastern Pacific Ocean between October 1, 1982 and February 28, 1983
In the above images provided courtesy of the Earth Systems Research Laboratory's Monthly/Seasonal Composite Web Page you can clearly see the above normal sea surface temperatures in the eastern Pacific ocean during the period of October 1, 1982 through February 28, 1983 with the highest values being almost 3.5 degrees Celsius above the normal for the area off the Western coast of South America. These images clearly show that there is something very unusual occurring in the eastern Pacific ocean in terms of the temperatures of the surface of the sea. To look further at what else was occurring at the time return to the main page and lets look at another item of data that may give us a clue as to what El Nino was doing to other aspects of the ocean or atmosphere.
|