| |
| George R. Kasica
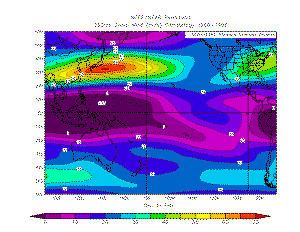
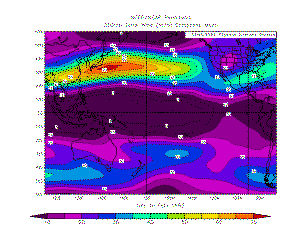
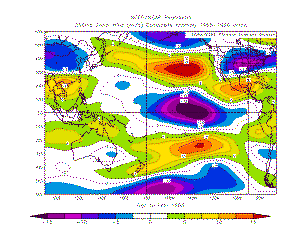
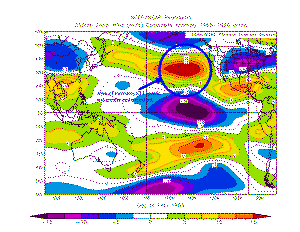
METEO 241 Portfolio #2: The 1982-83 El Nino and it's effect on the position and strength of the Subtropical Jet stream between October 1, 1982 and February 28, 1983
Looking at the above set of images you can see the normal position and strengths of the subtropical jet stream in the upper left hand image for a long term period from October through February over the years 1968-1986. Comparing this to the upper right image which is the plot of the 250mg subtropical jet stream for a period from October 1982 through February 1983 you can see that the subtropical jet was stronger and positioned farther to the east (closer to the US West Coast) than it was normally. Looking at the lower set of images which show the differences from the normal much more clearly (especially in the lower right hand annotated image) you can see an area of increased speeds and the location being much closer to the US West Coast. The effect of this repositioning will be shown in section five of this portfolio. To look further at what else was occurring at the time return to the main page and lets look at another item of data that may give us a clue as to what El Nino was doing to other aspects of the ocean or atmosphere.
|