| |
| George R. Kasica
METEO 241 Portfolio #2: The 1982-83 El Nino and it's effect on the temperatures and precipitation amounts over California and the Gulf Coast States between October 1, 1982 and February 28, 1983
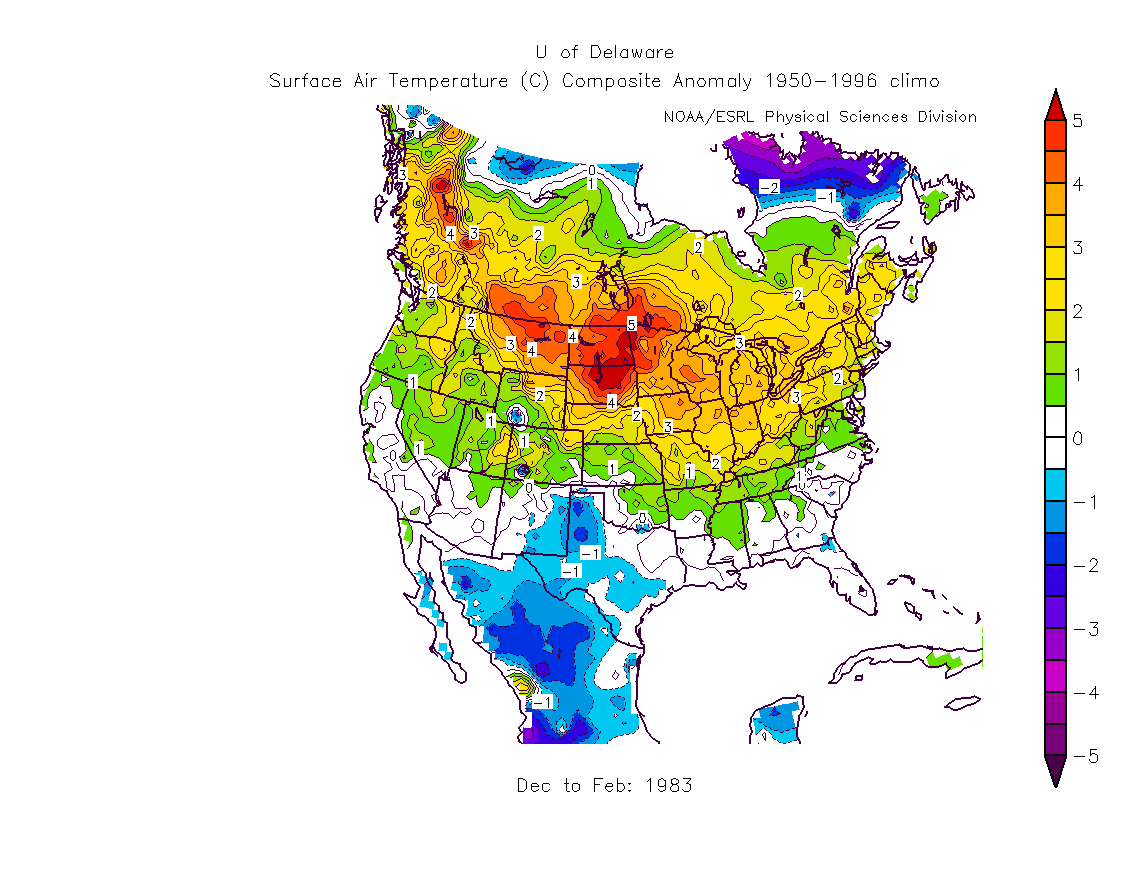
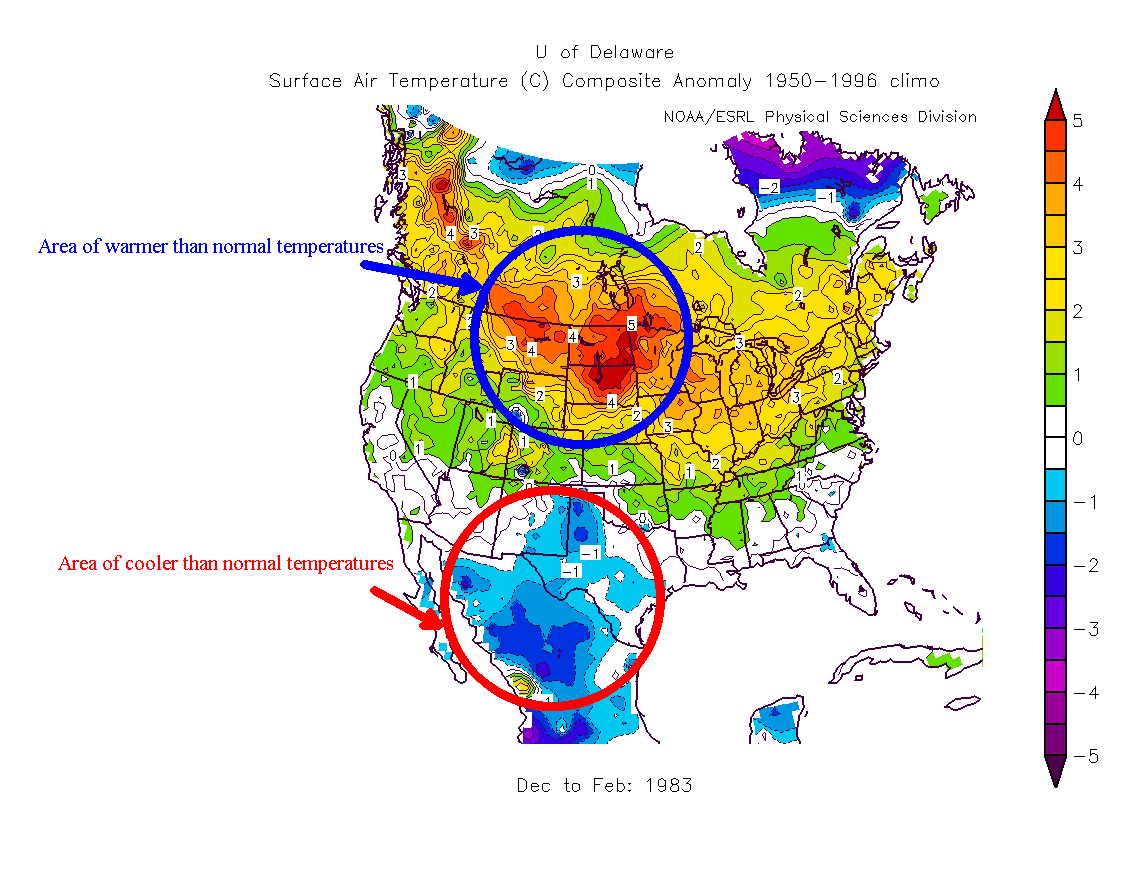
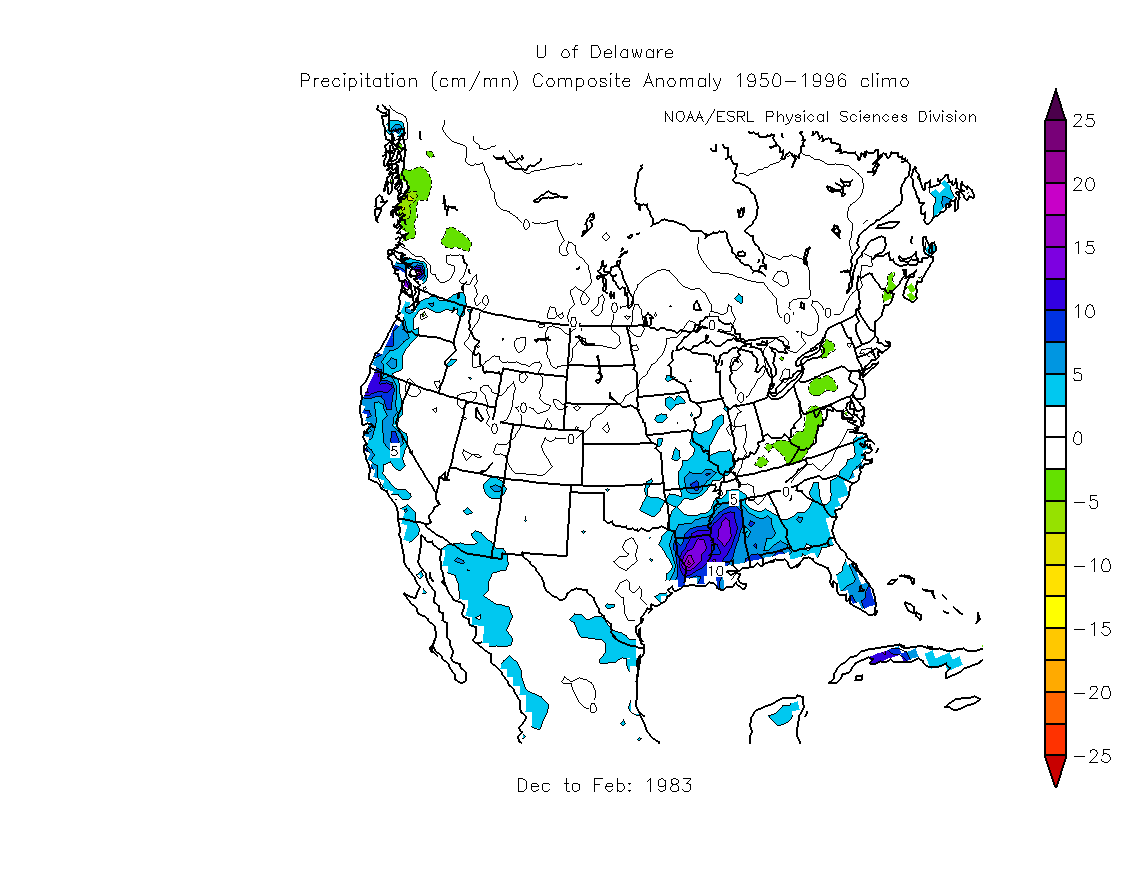
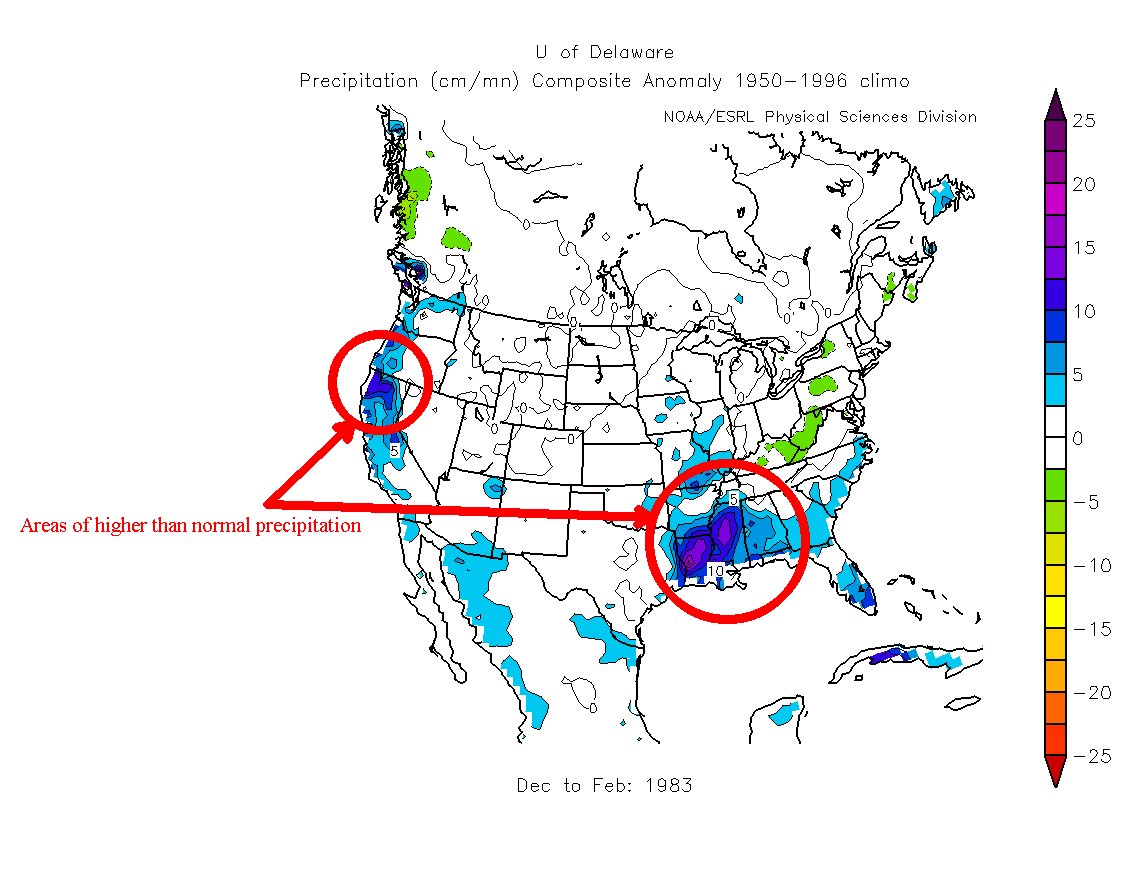
Looking at the above set of images you can see the effects of the various items we have looked at up to this point on the amounts of precipitation received and the temperatures on the US West Coast and the Gulf Coast States. In the upper set of images you can see that the effects of the subtropical jet being closer to the US West Coast leading to the push of more mild, moist maritime air on shore causing the temperatures to be more moderate (warmer) along the US West Coast and this is seen even more dramatically in the area of the Upper Plains states. Conversely you can see an area of cooler temperatures across the areas of Mexico and the western Gulf Coast area as the maritime air coming on shore there causes a moderation in the temperatures there as well, but in this case it tends to keep them cooler than they would be otherwise. In the lower set of images you can see the effect of the moisture coming on shore in these areas with dramatic evidence of above normal precipitation over northern California and the central Gulf Coast states. To look further at what else was occurring at the time return to the main page and lets look at another item of data that may give us a clue as to what El Nino was doing to other aspects of the ocean or atmosphere.
|