| |
| George R. Kasica
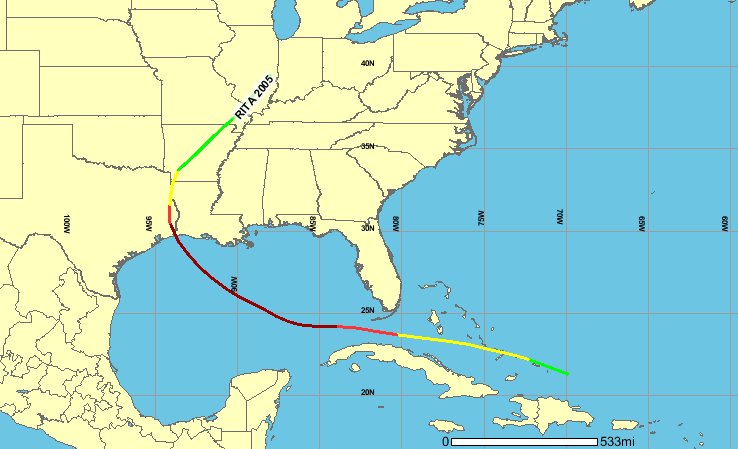
METEO 241 Portfolio #3: Analysis of the steering winds and track of hurricane Rita from September 18-26, 2005 In this section of our look at hurricane Rita we are going to look at the track of the storm from September 16-25, 2005 and why it followed the path that it did. Below you can see the complete track of the storm and how it moved in a mostly west-northwest direction before making a sharp turn to the north shortly before making landfall.
Why did it take the track that it did before making the abrupt turn to the north? For that answer lets look to the winds that prevailed during the period from September 18 - 26, 2005 at an level of 500mb, which is the level that typically has an impact on the steering and speed of these giant storms.
In looking at the above 500mb chart we can see that there was a ridge of high pressure that persisted through the period (the line labeled 5900 passing through southern Florida and westward to old Mexico) that helped to steer the storm and prevented it from turning to the north until it was into the western Gulf of Mexico. Another result of this ridge of high pressure keeping the storm to the south was that it kept it over the warm water of the southern Gulf of Mexico which enabled Rita to strengthen from a category two to a category 5 storm in just over 18 hours with a peak wind of 155kts. on September 22, 2005 while located 270 miles SSE of the area that it eventually made landfall on as a category 3 storm a few days later on September 24, 2005. To take a closer look at the conditions that existed just prior to Rita becoming a hurricane such as the sea surface temperatures, relative humidity and vertical wind shear click here or you can go back to look at another section from the main menu.
|