The Heartland Tornado Outbreak
March 11-12, 2006
|
|
|
This enhanced infrared satellite image shows the intense line of storms in yellow across the Oklahoma-Missouri-Nebraska-Illinois area at 01Z. Image courtesy of University of Illinois at WW2010 Surface Products. |
Introduction - Background of the Storm
The winter of 2006 was uneventful for the most part for those of
us here in the Kansas City, Missouri area.
Except for a good snow back in December 2005, it had been warm and dry, breaking
records for high temperatures and least amount of precipitation. For
someone studying mesoscale weather, this was heartbreakingly boring. Even
the trees and flowers gave up on winter ever coming and started to bud and bloom
two months early. However, the grass wouldn't green up with no rain, and
the world remained painted in sepia tones and dust.
On February 16, a front with moisture finally came through and a line of severe storms broke out east of Kansas City in St. Louis, as well as the southeast and midwest east of St. Louis. On March 9, another such front came through, affecting Oklahoma, Arkansas, Louisiana, Mississippi, and on east. On March 11, severe storms broke out south of Kansas City, with storm reports from southern Missouri, Arkansas, Oklahoma, Illinois, Indiana, and even Wisconsin.
The next day, March 12, was set up with the low on our doorstep (eastern Kansas and western/central Missouri), a southerly moisture flow (south winds bringing in warm Gulf air), the cold front still to our west with a temperature difference in the ballpark of 35-40 degrees F, and a dryline just west of the Kansas City area in Kansas. Other synoptic features in place were a potent upper level trough moving through, plenty of wind shear, and the warm front that went through on Saturday the 11th sitting in central Kansas/central Missouri across the state line. As early as 7:45 am CST on Sunday, a Severe Thunderstorm Watch had been issued for the Kansas City area and south down the state line. I collected all the Convective Outlooks, Mesoscale Discussions, and Severe Thunderstorm and Tornado Watches and Warnings pertinent to the Kansas City area in one document.
Supercell thunderstorms broke out on Sunday in three phases. The morning saw elevated convection with cold surface temperatures in Kansas, with storms also north and northeast of Kansas City. Early afternoon saw the second phase, with supercells firing up along the dryline and moving from far eastern Kansas into Missouri all along the state line. Some of these spawned tornadoes with fatalities reported. But the late afternoon and evening storms proved to be the most severe. Supercells kept erupting along the dryline and working themselves up into tornado-spawning entities throughout the evening until the squall line finally came through with the frontal passage around 10:00-11:00 pm CST (04Z-05Z). You can find the SPC Storm Reports here and a collection of radar images for the evening storm system here, as well as the detailed field analysis report from NWS Pleasant Hill, MO. For the day of March 12, there were 140 tornado reports, 127 wind reports, 402 hail reports, with total storm reports at 669. In the Kansas City area, there were 14 tornadoes confirmed, with 7 F0s, 1 F1, 4 F2s and 2 F3s identified by NWS field analysis. There were 6 fatalities for the KC Metro area alone (1 in the afternoon phase (Sedalia, MO), and 4 in the evening phase (1 in Urich, MO and and 4 in Renick, MO)*. This record outbreak will stand along with the Super Outbreak of April 3-4, 1974.
*Ongoing updates available on SPC Storm Reports page and NWS Pleasant Hill, MO page.
The Late Afternoon/Evening Outbreak and the Cell of
Focus
I have chosen to focus on an individual cell at the beginning of the late
afternoon/evening phase of the outbreak, as there was too much lightning by the
time this phase really got going and became extremely severe. [ I do have an
image from 02Z of one of the cells that produced a fatal tornado, which I will
outline at the end of this paper.] My focus is on images collected at 01Z,
or 7:00 pm CST, when the third wave of the outbreak had fired up storms all
along the dry line from east-central Oklahoma up through the Kansas City Metro
area and on up
into Illinois and Indiana. This can be clearly seen on the Base
Reflectivity image below for 0113Z (7:13 pm CST). These storms were moving
pretty fast - 50-55 mph - as can be seen on the subsequent Base Reflectivity
images at 0128Z (7:28 pm CST) and 0156Z (7:56 pm CST). Note also how the
circled cell grows in this short time, especially from the 0113Z image to the
0128Z image. (This cell barely skirted our place to the north, as it
traveled from northwest of us to northeast to east, as the images below
progress.)
 |
 |
| Link to SPC 0113Z Base Reflectivity SPC - Mesoscale Analysis Pages | Link to SPC 0128Z Base Reflectivity SPC - Mesoscale Analysis Pages |
 |
| Link to SPC 0156Z Base Reflectivity SPC - Mesoscale Analysis Pages |
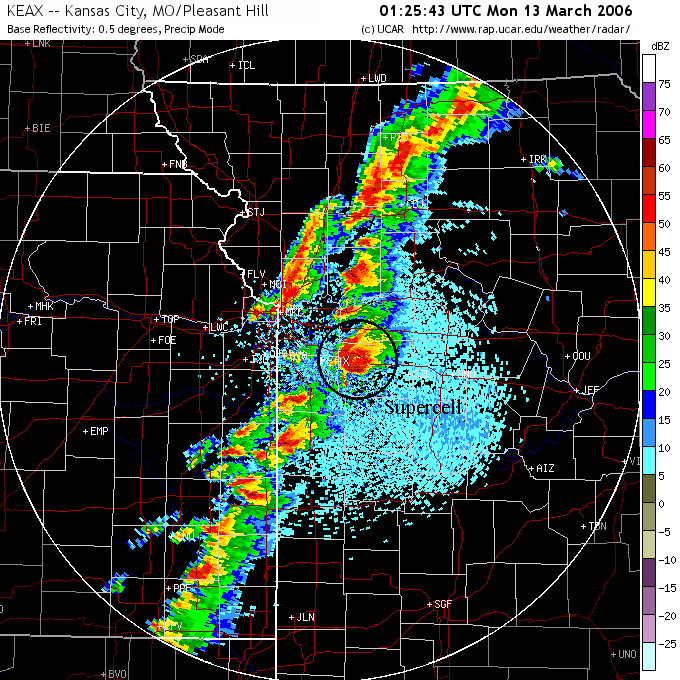
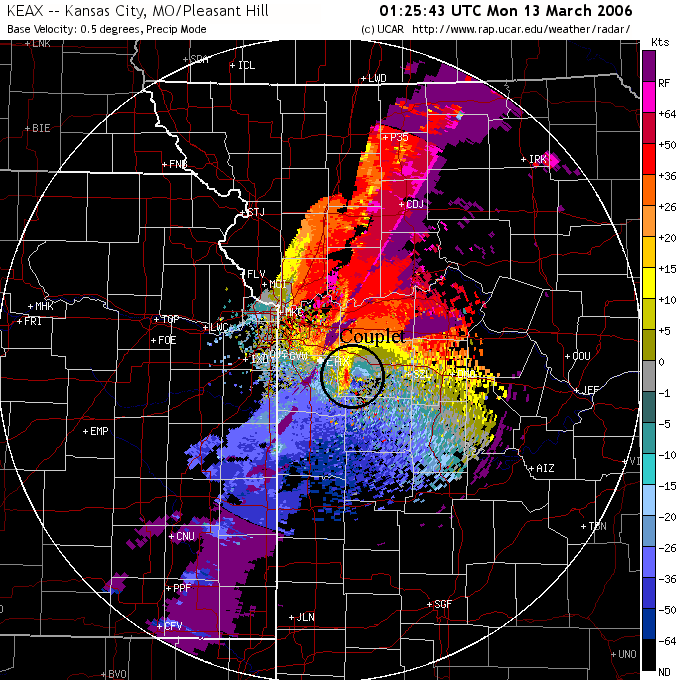
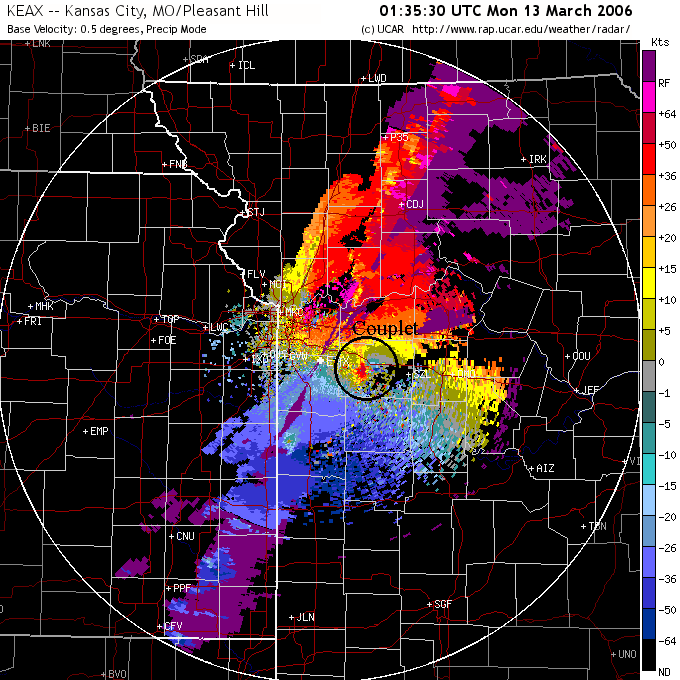
Below are the radar images and corresponding Doppler velocities from the local National Weather Service office in Pleasant Hill, MO. These were captured as the storms were producing wind, rain and lightning all around the area, including our place. There is a radar image missing for 0130Z because this was one of the 3 times that our electricity went out while I was trying to save images. It came back on almost immediately each time, but by then I'd missed the exact time-match window. Notice the large cell in all three radar images (circled) and the corresponding couplet on the Doppler velocity image (circled). You can see a very distinct mesocyclone rotating in that cell.
 |
 |
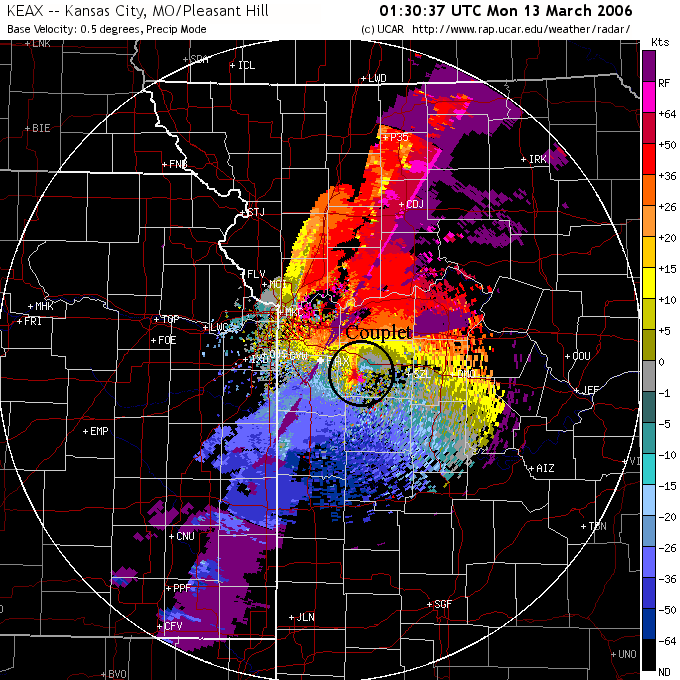 |
| NEXRAD Radar image at 01:25:43Z (7:25 pm CST). Image from RAP-UCAR website. Note the large cell near the middle of the image | Doppler Velocities radar image at 01:25:43Z (7:25 pm CST). Image from RAP-NCAR website. Note the same location of the cell on the radar where there is a couplet of mesocyclone rotation. | Doppler Velocities radar image at 01:30:37Z (7:30 pm CST). Image from RAP-NCAR website. You can still see the mesocyclone rotation couplet. |
 |
 |
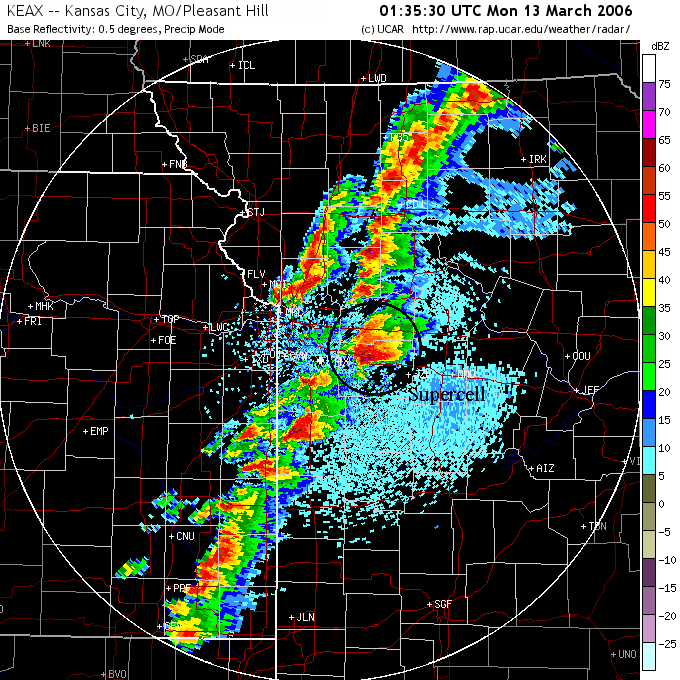
| NEXRAD Radar image at 01:35:30Z (7:35 pm CST). Image from RAP-NCAR website. Note how the cell has moved to the other side of the county, and the cell nearest the state line is growing rapidly. |
Doppler Velocities radar image at 01:35:30Z (7:35 pm CST). Image from RAP-NCAR website. Again, note the mesocyclone couplet. |
Behind the Scenes
Now that I've shown you all the cool snapshots of the storm at 01Z (7:00 pm
CST), it's time
to delve into some of the atmospheric variables that we look at to determine if
conditions are favorable for supercells to form. I'll choose four
variables and explain what each represents in relation to severe storm
development. These four variables are: 100 mb Mean Parcel CAPE and
CIN, Surface-Based Lifted Index and Surface-Based CIN, Surface Theta-E and
Advection, and Deep Layer Moisture Convergence. CAPE stands for Convective
Available Potential Energy, CIN stands for Convective Inhibition, and Theta-E
also means Equivalent Potential Temperature.
 |
| 100 mb Mean Parcel CAPE and CIN showing high values of CAPE at 1500-2000 j/kg and moderate CIN of -25. Image from the. SPC Mesoanalysis page. |
 |
| Surface-Based Unstable Lifted Index and Surface-Based CAPE showing high LI of -6 to -5, indicating very strong instability with high potential for thunderstorms. Image from the SPC Mesoanalysis page. |
The first chart (above-left) is 100 mb Mean Parcel CAPE and CIN. CAPE (Convective Available Potential Energy) measures how much potential there is in the entire atmosphere for air parcels to rise rapidly (positive buoyancy). Rising (buoyant) air parcels are necessary for convection, which gives us our building cumulus clouds (including thunderheads, called convective towers). CAPE is measured in joules per kilogram (j/kg). Higher values of CAPE indicate areas with high instability, which helps pave the way for severe storms to develop. On the attached chart, which represents conditions in the first 100 mb of the atmosphere, you can see the CAPE (red contours) values of 2000 and 1500 in the Kansas City area. You could say we were ripe for it, as these are considered high values. The CIN (Convective Inhibition) is the blue shading, with blue values you can barely see. The CIN value of -25 near the state line indicates moderate inhibition of convection, and coupled with the high CAPE, wasn't sufficient to keep storms from forming.
Next (above-right) is the Surface-Based Unstable Lifted Index and Surface-Based CAPE chart. This says surface-based as it represents the values from the surface to 500 mb, which is roughly 18,000 feet. Lifted Index (LI) measures the the temperature of the parcel in relation to its surroundings at 500 mb, which is a factor in its buoyancy. The readings for LI of -6 and -5 in central/western MO by the state line indicate very strong instability (positive buoyancy) with a high potential for severe thunderstorms to erupt. And they did.
 |
| Surface Theta-E/Advection showing high values of Theta-E warm, moist air. Image from the SPC Mesoanalysis page. |
 |
| Deep Layer Moisture Convergence showing high values (red contours) of moisture through a deep layer of the atmosphere. Image from the SPC Mesoanalysis page. |
The third chart (above-left) is for Surface Theta-E/Advection. Theta is a Greek symbol and along with the E represents Equivalent Potential Temperature, which combines temperature and dew point into one value to determine how warm and moist the air is. Advection is the movement of said air by the winds. Theta-E represents to what extent warm, moist air is present to destabilize the atmosphere. Remember one of the things we had in place on the synoptic scale was a warm flow from the Gulf of Mexico to the south and from the Pacific across Mexico to the southwest. Pacific and Gulf air is warm and moist and brings humid conditions (raised dew points, which we had in the warm sector ahead of the frontal boundary). The higher numbers in green (332 and 334, temperature in Kelvins) show areas of high theta-e air (warm and moist), which sets the stage for afternoon and evening convection (bingo). This was very unstable air! The purple contours and numbers indicate to what extent this air is being brought in by the winds. Note the values of 10 and 15 in the Kansas City area - the contours show that the air has run up against the warm frontal boundary and is pooling there.
The last chart (above-right) is for Deep Layer Moisture Convergence. This is related to dynamic and thermodynamic forcing/lifting on the synoptic scale. Now what does that mean? Moisture converges (the high theta-e blowing in) and the rising air parcels (forcing/lift) take it up into the upper levels of the atmosphere (deep layer), where divergence aloft occurs, setting the stage for storm development. High values (red contours) of moisture convergence reflect a lot of forced ascent of this warm, moist air, which gives the various levels of the atmosphere a lot of moisture to work with. This much convergence at this low level combined with strong vorticity are a couple of variables favorable for tornadoes to form (as long as the large-scale convection keeps developing). However, these are not the only factors that need to be in place for tornado development, other factors being out of the scope of this paper.
Skew-Ts and Hodographs
Now it's time to look at the profile of the atmosphere all the way from the
surface to the upper troposphere.
Skew-T/LogP Diagrams are maps of data
collected for a number of variables (temperature, dew point, pressure, wind speed
and direction, etc.) throughout the various levels of the
atmosphere. All the lines and numbers have a meaning and a use for
determining things like CAPE, CIN, LI, LCL (where clouds are likely to form), whether precipitation
is likely to fall and what type it is, moist air/dry air. The list goes
on. Hodographs (small circle in upper left corner) indicate a plot for wind speed and direction for various
levels of the atmosphere, and is useful for determining wind shear (change of
wind speed and/or direction with height, which relates to rotation). The closest Skew-T and Hodograph I could get was for Topeka, and the cells
formed just east of there in the late afternoon and evening. Below are a
pretty blue one from Unisys for 12Z (6:00 am CST) on the 12th, and two from
University of Illinois for 18Z (12 noon CST on the 12th) and 00Z (6:00 pm CST the
12th) the 13th.
 |
|
The Skew-T diagram for 12Z March 12, 2006 (6:00 am CST), from the Unisys Upper-Air Soundings website. Note the wind shear illustrated by the wind barbs on the right. |
 |
 |
|
The Skew-T diagram for 18Z March 12, 2006 (12:00 pm CST), from the RAP-NCAR Upper Air website. Note the inversion from the surface to about 895 mb, and the rightward curve of the hodograph wind plot.
|
The Skew-T diagram for 00Z March 13, 2006 (6:00 pm CST) , from the RAP-NCAR Upper Air website. Note the dry air from the surface to about 670 mb.
|
The red line is the temperature and the green line is the dew point - when they meet through a deep layer, it indicates the atmosphere is saturated, which is favorable for precipitation. The wind barbs at the right show the wind direction and speed at various levels of the atmosphere, and you can see that they do change from the surface up to 500 mb, indicating shear. Sure enough, the hodograph (little circle at the upper left corner) shows the wind plot line veering to the right subtly, which is an indicator of severe weather potential. One thing I want to point out here (on the Skew-T) is the temperature and dew point line rising to the right up to about 890 mb, which indicates an inversion (stability), and the large space between these two lines at 700 mb, which indicates a dry layer (a cap for convection to break through in order for severe storms to form). At 12 noon on the 12th, there was surface saturation but convection had not broken the cap yet (the cap is the top of the inversion). By 6:00 pm, the system had rained out in Topeka, as indicated by the large space (dry air) from the surface to 650 mb - true enough, all the storm activity was ongoing east of Topeka, mostly in southwestern and central Missouri by this time.
The first sounding for 12Z (6:00 am CST) on the 12th shows the setup of the atmosphere for the day's events. This sounding shows upper-level clouds (lines are close at 750 mb) and a dry layer from 760 mb to 800 mb, which is another factor for potential instability. Also, the surface inversion was in place which indicates stability, but the winds were shearing and, along with convection, would likely mix the atmosphere into instability (the winds form eddies that mix the surface air with the upper level air).
Meteograms, or a Map of How the
Day Played Out
Meteograms are graphic maps that plot surface data to show a history of actual occurrences
(as opposed to the Skew-Ts, which plot data for all levels of the atmosphere). Their
limitation is that they are based at airports and weather stations, and may not
reflect conditions at other locations in between. These meteograms (below) are from
the Kansas City Airport, which is way north of the city, while the storms in
question were forming to the south and southeast of the city. However, you
can see the passage of the front on the 0300Z meteogram (note the wind shift at
15Z), and thunderstorms show up at 15Z and 20Z with rain and hail in between.
00Z, 01Z and 02Z show a symbol that's not on our symbol key, which coincides
with our focus on 01Z data. Rain and fog follow beginning at 05Z (1500Z
graph) and coinciding with the temperature drop (and subsequent drop in dew point
since the storms were ending here). By 09Z the winds had shifted all the
way to the east (winds from the east) and picking up to be quite gusty until the
meteogram ends at 15Z the next day (9:00 am CST). Unfortunately, due to
the location of the airport in relation to the line of supercells and the
squall line that developed around 3:30-4:00 pm with the frontal boundary
passage to the south, no supercells or tornadic cells were captured on these
meteograms.
 |
|
Meteogram for KMCI from 0300Z March 12 to 0300Z March 13 (9:00 pm CST March 11 to 9:00 pm CST March 12) 2006. Note the wind shift, the thunderstorms at 15Z and 20Z, and the strange little arrows during our 01Z focus. Image courtesy of the Unisys Surface Meteograms website. |
 |
|
Meteogram for KCMI from 1500Z March 12 to 1500Z March 13 (9:00 am CST March 12 to 9:00 am CST March 13) 2006. Note the thunderstorms at 15Z and 20Z, the strange little arrows during our 01Z focus, the temp and dew point drop at 04Z (with passage of the squall line - note the crazy winds there) and the wind gusts beginning at 09Z. Image courtesy of the Unisys Surface Meteograms website. |
Far-Traveling Cell and Hook Echo Cell
Now that I've taken you through some of the behind-the-scenes
data on one cell in one phase of the outbreak, I'd like to point out a couple of
interesting things from other parts of the entire day's storm system.
Also, I've attached
radar images
from 2356Z March 12 to 0557Z March 13 (5:56 pm CST to 11:57 pm CST
March 12) which show the entire progress of the late afternoon/evening phase of
the outbreak, ending with the squall line that came through with the frontal
passage.
Of note is that there was one major cell that formed at the Oklahoma/Kansas border during the afternoon phase of the outbreak (around 5:00 pm CST), which moved through the Clinton and Sedalia areas (east central Missouri, southeast of KC Metro area), spawned a number of separate tornadoes, and kept itself intact until it reached Indiana around sunrise March 13th. This single cell traveled 400-500 miles before it finally dissipated! In comparison, the life-cycle of a single thunderstorm cell is usually about one hour, and this cell stayed intact for roughly 14 hours! Conditions remained favorable for the cell to continue regenerating, as outflow and downshear stayed clear of the updrafts, allowing the storm formation variables to remain intact and the cell to keep feeding on itself. On the 2356Z radar image in the link above, you can see the two large cells off to the northeast - one of those cells is this long-lived cell.
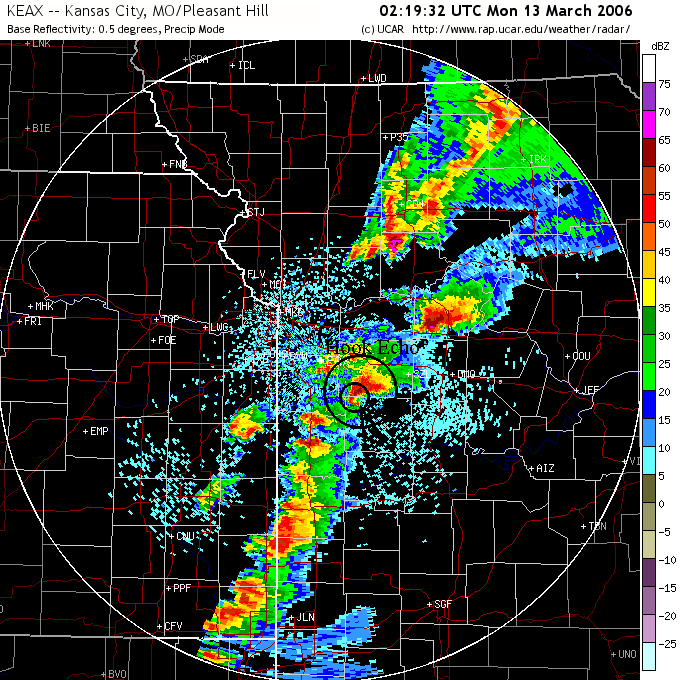
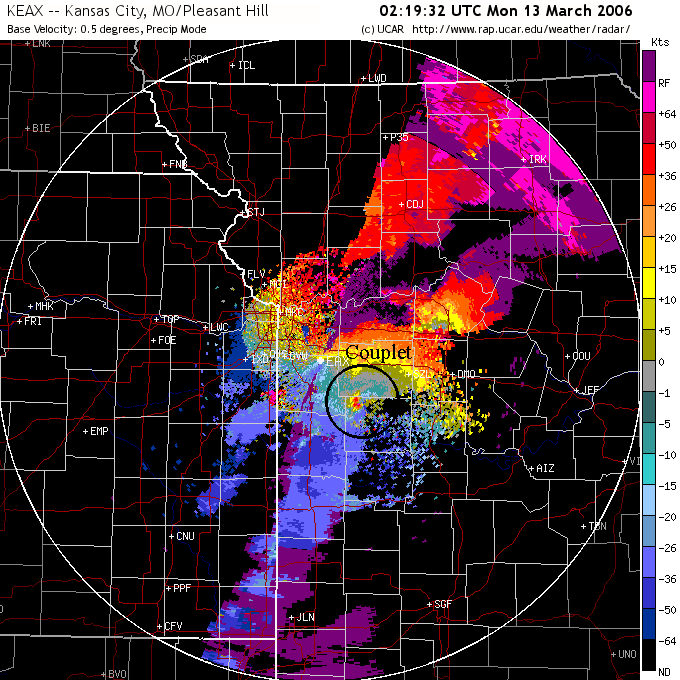
In addition, I was able to capture the radar image and Doppler velocities for a cell in the evening phase of the outbreak that spawned the fatal tornado in Urich, MO. The radar image for 0219Z (8:19 pm CST) below shows a pronounced hook echo and the Doppler velocities radar image beside it shows the mesoscale couplet. This image depicts winds moving away from the radar and winds moving toward the radar, and the couplet is where they are very close together, indicating rotation (mesocyclone). As for a TVS (Tornado Vortex Signature), I think I see one blue dot in the red area, which would indicate very small-scale rotation (twister). I've circled the couplet showing the mesocyclone, which could possibly contain the supposed 'blue dot' TVS. Though a TVS on radar is very rare, this storm was in close proximity to a radar station (Pleasant Hill), increasing the possibility of the signature being apparent on the image.
 |
|
This radar image from 02:19:32 UTC (8:19 pm CST) clearly shows the hook echo in the large cell nearest the center of the image. This hook echo is the signature of a mesocyclone, which indicates rotation. Image courtesy of the RAP-NCAR website. |
 |
|
This Doppler velocities radar image from 02:19:32 UTC (8:19 pm CST) matches the radar image showing the cell with the hook echo. In the same location of the cell, you can see a couplet, which is an image of opposing winds in a small area (winds moving away from the radar and winds moving toward the radar in close proximity) which indicates rotation. This is the wind signature of the mesocyclone, which indicates rotation. Image courtesy of the RAP-NCAR website. |
In the radar image for 0234Z (8:34 pm CST), you can see the cell moving out of Henry County and into Johnson County, Missouri. The fatality in Urich had already occurred by this time, at 0211Z (8:11 pm CST) 3 miles west of Urich in Henry County, MO. A man's house was destroyed and he was thrown out into the field, where he died. This was one of the many sobering occurrences of the day's outbreak, reminding one of how fragile our lives can be on this planet when we're forced to stare down Mother Nature's fury. The fact that in an outbreak of this magnitude there were relatively few fatalities is a testament to the awareness of the public and the advent of technology and science to warn in as timely a manner as possible. We've come a long way since 1974.
Reflections
This project was the epitome of why I'm taking these classes. I wanted
to be able to put together a storm history and understand what made it happen.
It was also fascinating - exhilarating - to be able to put together a story on a
storm that I personally experienced, using the tools of my 'trade' in concert
with the unfolding wethe event. I also learned that the hardest part
in doing that was playing the computer vs. lightning game.
In the Classroom the morning after, I posted a report with the preliminary storm reports and coverage from the local National Weather Service office and the local Fox 4 weather team (scroll down to Tuesday, March 14, 2006 (Joe Lauria) and the entry below that one (Casey Curry) for preliminary stats, preliminary tornado location graphic, and tornado pics from Sedalia). In that posting, I mentioned that this outbreak was a record-breaker and would stand along with the Super Outbreak of April 3-4, 1974. By the end of the week, the local National Weather Service office posted a short storm synopsis, and they mentioned the same thing, which made me proud that I had recognized that myself. (The links at the bottom of the 'storm synopsis' page are no longer valid; however, the text and images from these links were copied into the 'local National Weather Service office' link at the beginning of this paragraph.)
However, the storm reports are very sobering. One in particular struck way too close to home. An F3 went through the Pomme de Terre lake area between Pittsburgh and Hermitage (one hour northeast of Springfield, MO), heavily damaging a place called Carson's Corner (7 injuries). Carson's Corner is a little corner at the end of a neighborhood that has a little store, a boat storage facility, a gas station, a curio shop, and I think a little repair place. I can't remember exactly, but this sounds about right - my point is that it's small - literally a corner. The neighborhood is where my mother moved to when she sold our house in Dallas. She's gone now, but I still have relatives in the town of Galmey across the dam and down the road from Carson's Corner, with a house out on the tip of a finger of land jutting between two coves. This F3 came perilously close to their house on its trek to Hermitage. They did a visual of the damage the next day (I called and told them what I read in the storm report), and it was so strange to hear that some of these places were gone. They had to go the long way around because the dam road was blocked due to damage. The tornado didn't damage the neighborhood, only the Carson's Corner area. It gave me the strangest feeling to hear about this - I can't explain it. If I hadn't read the NWS storm report and found the Carson's Corner damage entry, I wouldn't have known this or been able to tell them about it. Saying it made me feel good isn't the right statement, but I was glad that I had this access and ability to research the storm for myself and be able to pass along the knowledge I gleaned from the report. I'm going this weekend to take a first-hand look at the damage. Maybe I can post some pictures here later.
I also liked being able to see on the radar what was coming our way - especially when I could also see it on the horizon at the same time. There's something almost magical about that. Knowing it's coming is invaluable to me. The people around me may be tired of hearing about the weather all the time, but they appreciate me when they need to know what to expect. I wish my mother were here to see what I've accomplished. Every time it would "cloud up" she'd go get the book of state maps that outlined all the counties and cities and we'd watch the weather (Harold Taft, Channel 5, Dallas, Texas, 1960s and 1970s) and determine where the storms were in relation to our house. I'd never really thought of it before, but I guess you could say she fed my interest in meteorology by doing that. I still have that book.
In closing, I'd like to say that I learned a lot from accessing images while the storm was occurring. Real-time field learning is the best way to understand what we're trying to learn. I guess you could call this armchair storm chasing! And of course it's always interesting to live through an historical event (and humbling to survive to tell the story).
Debbie Jarvis-Ferguson
March 24, 2006
Meteo 361
NOTE: The Kansas City National Weather Service office posted the official record-breaking totals for tornados in 2006 in Missouri at the end of the year. From there, you will find links at the bottom of the page to the 2006 Climate Summary for the Kansas City, Missouri area, along with the normals and averages in temperature, precipitation and winds. Linked within the summary are the March 12th Tornado Outbreak, the July 11th Deluge, and the November 29th Winter Storm.