
IVAN THE TERRIBLE
Hurricane Ivan was one of four hurricanes to strike storm weary Florida in the summer of 2004, the only one of the
Hurricane Ivan was one of four hurricanes to strike storm weary Florida in the summer of 2004, the only one of the
season to become a category 5 on the Saffir-Simpson Scale. Not only did Ivan devastate areas of the Lesser Antilles
all the way to the Central Gulf Coast, it, also, caused tremendous flooding and record rains north to the Middle Atlantic
States. Ivan had a very long life for a hurricane, strengthening and weakening many times, as shown in the image below.
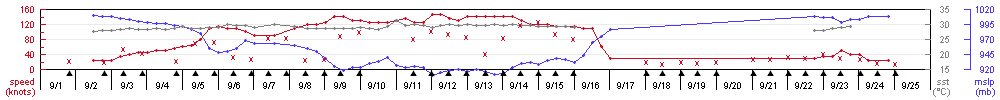
This image shows Ivan's fluctuations in strength with the red line representing winds and the blue line representing pressure, courtesy of Remote Sensing Systems.
I decided to investigate hurricane Ivan for a couple reasons. First, living in western Pennsylvania, I don't often get to
experience the effects of a hurricane, but with Ivan, all I had to do look out my window to see some of the flooding:
The creek below my house severely flooded, sparing my house though. One day rainfall records were smashed all over
the area, including my own 18 year record. Also, I know someone who was in Pensacola the night Ivan struck. He
worked on the Naval Base and had to go to a shelter for protection, before helping to clear the destruction, which as you
will read was extremely widespread. In this assignment, I will be taking a look at the remote sensing techniques used to
determine Ivan's strength in the Gulf of Mexico as it took aim for the Alabama and Florida coasts.
IVAN'S LIFE AND DEATH
Ivan developed from a large tropical wave that moved off the west coast of Africa on August 31. By the afternoon
of September 2, deep convection formed around the center and the National Hurricane Center (NHC) gave it tropical
depression status. The next day the NHC upgraded this depression to tropical storm Ivan as it was just southwest of the
Cape Verde Islands, a classic Cape Verde storm. You can see from the track below exactly where Ivan became a tropical
storm and where it moved next.
Despite a relatively southern latitude of approximately 10 degrees N, Ivan strengthened as it continued on a westward
track through the central Atlantic. Ivan became a hurricane on September 6, while it was about 1000 nautical miles
east of the Caribbean. After Ivan reached hurricane strength, the rate of intensification increased dramatically and in an
18 h period Ivan strengthened into a major category 4 hurricane with peak winds of 135 mph. This made Ivan the
southernmost major hurricane on record. Luckily, as Ivan crossed the island of Grenada, it weakened back to category
2 status. By this time, Ivan was investigated by hurricane hunter aircraft. Unfortunately, Ivan's weakening stage was
temporary as it went through the Carribean Sea.
This image shows the trough over the U.S. that
steeeed Ivan to the north,
courtesy of Earth Systems Research Library
The forces of Ivan were directly responsible for 92 deaths that ranged from tornadoes to storm surge to floods and mud
slides. Ivan was indirectly responsible for 32 more deaths in the U.S. alone. With damage estimates over 14 billion in the
U.S. and three billion in the Caribbean, Ivan the Terrible certainly lived up to its name.
REMOTE SENSING AND ANALYSIS
In the paragraphs that follow, I will discuss more about how the NHC used remote sensing to determine Ivan's strength.
On the afternoon and evening of September 14, about 36 hours prior to landfall, Ivan was still a category 4 hurricane with
winds near 140 mph (120) knots. I chose this time, because once a storm is in the Gulf of Mexico, it's almost certain to
strike the United States. In this case, Ivan still was extremely dangerous, giving us a lot of interesting information to look at.
VORTEX MESSAGES
Once a tropical system begins to develop, aircraft reconnaissance, NOAA's P3 aircraft, flies into the storm to retain timely
data about the storm. These planes have a number of weather sensors that relay coded information back to the NHC. Some
of this information goes into decoded vortex messages, which gives forecasters additional information about a storms winds,
pressure and movement. A sample vortex message along with a guide to decoding them can be found here, courtesy of PSU.
A look down
into Ivan's eye from aboard NOAA's P3 aircraft, courtesy of Hurricane Research Division
Sections I & J also help determine a storm's intensity and whether it's weakening or strengthening. Line I represents the
flight level maximum temperature outside the eye. For Ivan, the temperature was 11 degrees C at 3078M, while the
temperature inside the eye was 16 degrees C at 3086M, as shown on line J. The difference between the two is an indicator
of how healthy the storm is. While Ivan was at its strongest, the difference in these two numbers was over 10, but at the
time of this vortex message, the difference was only five. This means that Ivan was still a dangerous storm; however, it
was another sign that Ivan began to weaken.
SCATTEROMETRY
A scatterometer is a device on some weather satellites that forecasters use to determine a storm's wind speed and direction.
It uses a high frequency radar to gauge the roughness of the sea surface. A rough sea equates to high winds and a calm
sea equates to light winds. This is especially useful for areas in the central and eastern Atlantic where hurricane hunters
don't fly, giving forecasters the first sign of development; however, there are a couple drawbacks to scatterometry.
First, these instruments are attached to polar orbiting satellites. As they make progressive passes around the Earth, blind
spots can occur, meaning a storm could be completely missed. Also, very heavy rain, which is common in a hurricane's
eyewall, contaminates the information being received.
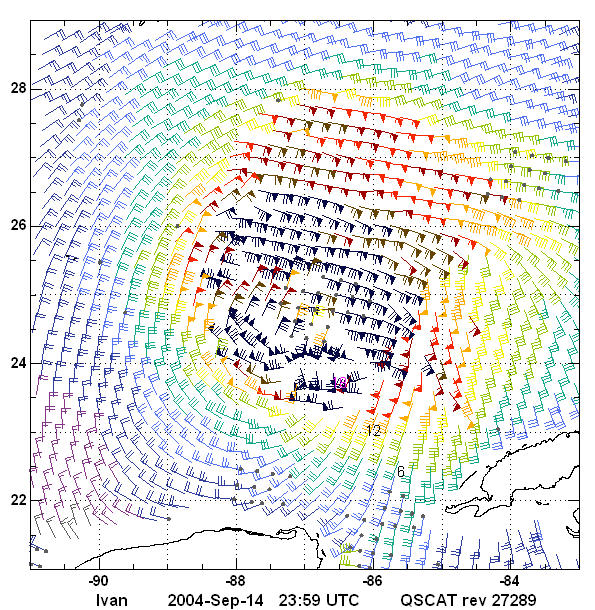
Fortunately, this image below is fairly accurate, but some mistakes remain. Ivan's maximum sustained winds at this time
were 120 knots and the image shows several wind barbs with readings between 100 and 115 knots, however, the gray dots
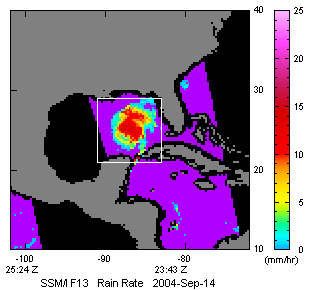
near the eye mean that is the most likely location for errors. The SSM/I rainfall graphic on the right shows that it was raining
as high as 15 mm/hr. It's this heavy rain that causes mistakes, but the benefits far outweigh the drawbacks.
Quikscat graphics courtesy of Remote Sensing Systems .
They show the wind fields of Hurricane Ivan and the SSM/I Rain
Rate.
WIND ANALYSIS
Once a storm is closer to land, wind analyses from the Hurricane Research Division offer useful data to forecasters. These measurements are taken from a variety of resources, as shown in the figure below. Observations from GPS Dropwindsondes,
a moored buoy, a C-MAN station, a ship, a satellite and SMFR (which I will discuss later) went into making this detailed
image of Ivan's wind direction and wind speed ten meters above the surface, approximately 27 hours before landfall. The
circular contours around the eye represent Ivan's wind speed in knots and it shows exactly where the strongest winds are. In
this case, the worst winds are on the eastern side of the storm, which is common as the right-front quadrant of a hurricane is
often the most deadly.
The conclusion made from all these observations is on the bottom of this image: the analyzed maximum wind speed is 120
knots (near 140 mph) 23 nautical miles northeast of the center. This is the same as the NHC had the storm at this time. This
wind analysis is even more accurate than scatterometry; however, it is only taken closer to land, unlike scatterometry.
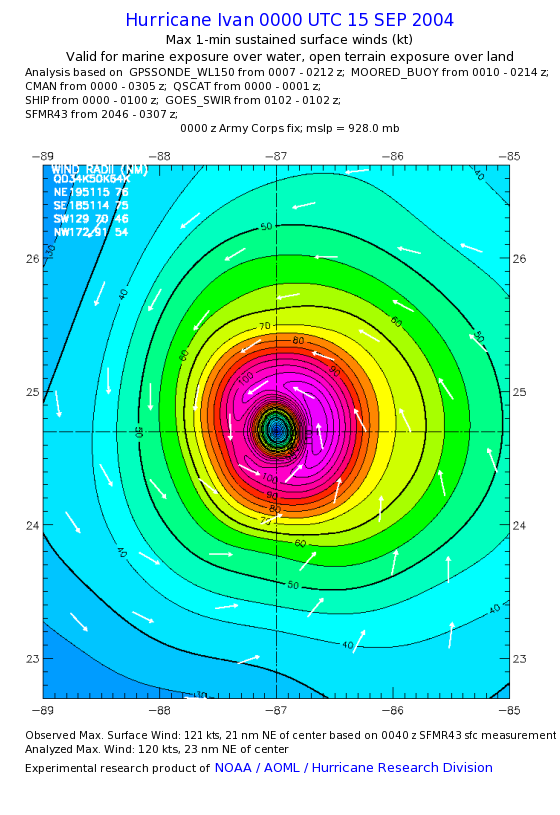
This is a wind analysis of Ivan, showing the exact locations of the strongest winds,
courtesy of the Hurricane Research Division.
I mentioned earlier that SMFR (Stepped Microwave Frequency Radiometer) is used in wind analysis, but you might be
wondering what that is. It is a tool mounted on NOAA's P3 aircraft that senses high level microwaves emitted from the
sea surface. If the sea surface is rough and foamy from high winds, more amounts of microwave energy are sent back
to the aircraft. Computer models are able then to calculate wind speeds from these measurements helping the NHC
determine the wind speed. On the bottom of the image above, SMFR measured a wind speed of 121 kts 21 nm NE of the
center of Ivan, basically the same as the analyzed max wind.
Even though Ivan weakened to a category 4 at this time and eventually a category 3 at landfall, it's a storm that will be
remembered for a long time. Not only did it cause massive destruction over a wide area, it also had one of the longest
tracks in history: an astonishing 5,600 nautical miles and a life span of 22 days.
all the way to the Central Gulf Coast, it, also, caused tremendous flooding and record rains north to the Middle Atlantic
States. Ivan had a very long life for a hurricane, strengthening and weakening many times, as shown in the image below.
This image shows Ivan's fluctuations in strength with the red line representing winds and the blue line representing pressure, courtesy of Remote Sensing Systems.
I decided to investigate hurricane Ivan for a couple reasons. First, living in western Pennsylvania, I don't often get to
experience the effects of a hurricane, but with Ivan, all I had to do look out my window to see some of the flooding:
The creek below my house severely flooded, sparing my house though. One day rainfall records were smashed all over
the area, including my own 18 year record. Also, I know someone who was in Pensacola the night Ivan struck. He
worked on the Naval Base and had to go to a shelter for protection, before helping to clear the destruction, which as you
will read was extremely widespread. In this assignment, I will be taking a look at the remote sensing techniques used to
determine Ivan's strength in the Gulf of Mexico as it took aim for the Alabama and Florida coasts.
IVAN'S LIFE AND DEATH
Ivan developed from a large tropical wave that moved off the west coast of Africa on August 31. By the afternoon
of September 2, deep convection formed around the center and the National Hurricane Center (NHC) gave it tropical
depression status. The next day the NHC upgraded this depression to tropical storm Ivan as it was just southwest of the
Cape Verde Islands, a classic Cape Verde storm. You can see from the track below exactly where Ivan became a tropical
storm and where it moved next.
 |
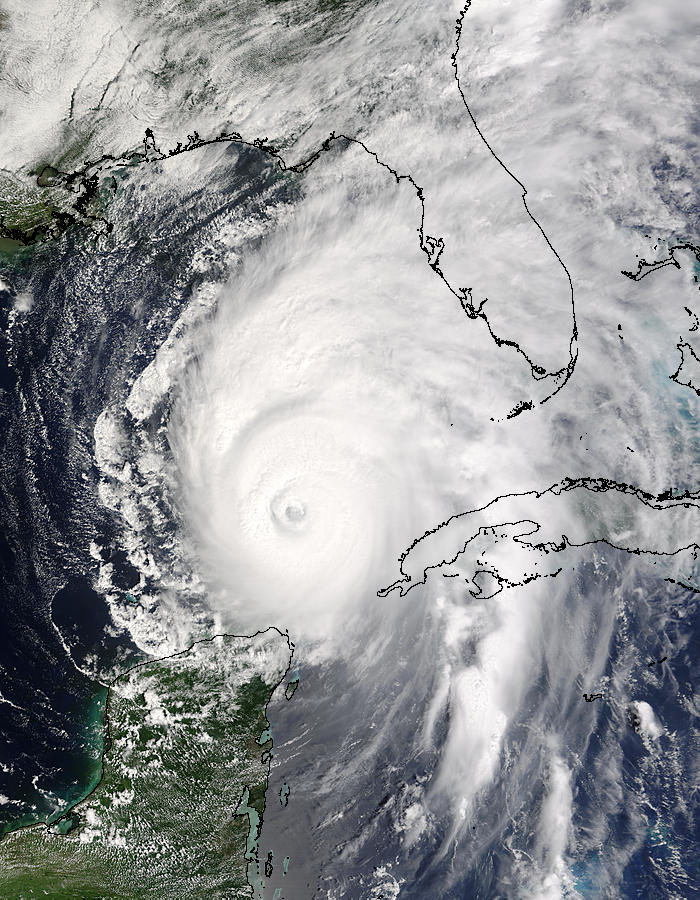 |
| This image shows Ivan's 5600 nm track, courtesy of Weather Underground | Ivan in the Gulf of Mexico 36 hours prior to landfall, image courtesy of Hurricane Research Division |
Despite a relatively southern latitude of approximately 10 degrees N, Ivan strengthened as it continued on a westward
track through the central Atlantic. Ivan became a hurricane on September 6, while it was about 1000 nautical miles
east of the Caribbean. After Ivan reached hurricane strength, the rate of intensification increased dramatically and in an
18 h period Ivan strengthened into a major category 4 hurricane with peak winds of 135 mph. This made Ivan the
southernmost major hurricane on record. Luckily, as Ivan crossed the island of Grenada, it weakened back to category
2 status. By this time, Ivan was investigated by hurricane hunter aircraft. Unfortunately, Ivan's weakening stage was
temporary as it went through the Carribean Sea.
 |
Shortly after Ivan emerged into the Gulf of Mexico on September 14, the storm turned north-northwestward then north, due to a trough of low pressure over the central United States and the southerly flow ahead of it, as shown in the 500mb analysis to the left. With the storm now taking aim on the coasts of Alabama and the western Florida panhandle, this low pressure over the central U.S. caused vertical wind shear over the storm to increase, weakening the storm slightly. Ivan finally made landfall at Gulf Shores, Alabama on September 16, at 0650 UTC (1:50 CDT), with sustained winds of 120 mph. With Ivan now on land, it quickly weakened; however, the damage was far from over because severe flooding occurred all the way to the Middle Atlantic States. |
courtesy of Earth Systems Research Library
The forces of Ivan were directly responsible for 92 deaths that ranged from tornadoes to storm surge to floods and mud
slides. Ivan was indirectly responsible for 32 more deaths in the U.S. alone. With damage estimates over 14 billion in the
U.S. and three billion in the Caribbean, Ivan the Terrible certainly lived up to its name.
REMOTE SENSING AND ANALYSIS
In the paragraphs that follow, I will discuss more about how the NHC used remote sensing to determine Ivan's strength.
On the afternoon and evening of September 14, about 36 hours prior to landfall, Ivan was still a category 4 hurricane with
winds near 140 mph (120) knots. I chose this time, because once a storm is in the Gulf of Mexico, it's almost certain to
strike the United States. In this case, Ivan still was extremely dangerous, giving us a lot of interesting information to look at.
VORTEX MESSAGES
Once a tropical system begins to develop, aircraft reconnaissance, NOAA's P3 aircraft, flies into the storm to retain timely
data about the storm. These planes have a number of weather sensors that relay coded information back to the NHC. Some
of this information goes into decoded vortex messages, which gives forecasters additional information about a storms winds,
pressure and movement. A sample vortex message along with a guide to decoding them can be found here, courtesy of PSU.
 |
On these missions pilots also make visual observations, like the picture on the left. These visual observations also help determine a storm's strength, like on line L of this decoded vortex message of Ivan, approximately 30 hours prior to landfall. Ivan's eye was closed at this time, which could've been taken visually or by radar. Line H shows Ivan's pressure to be 931 mb, which is consistent with the storm's category 4 strength. Luckily for the residents of Alabama and Florida, Ivan's pressure started to rise by this time. Even though the storm weakened slightly, it by no means meant that Ivan was a weak storm, as you learned in the damage statistics. |
Sections I & J also help determine a storm's intensity and whether it's weakening or strengthening. Line I represents the
flight level maximum temperature outside the eye. For Ivan, the temperature was 11 degrees C at 3078M, while the
temperature inside the eye was 16 degrees C at 3086M, as shown on line J. The difference between the two is an indicator
of how healthy the storm is. While Ivan was at its strongest, the difference in these two numbers was over 10, but at the
time of this vortex message, the difference was only five. This means that Ivan was still a dangerous storm; however, it
was another sign that Ivan began to weaken.
SCATTEROMETRY
A scatterometer is a device on some weather satellites that forecasters use to determine a storm's wind speed and direction.
It uses a high frequency radar to gauge the roughness of the sea surface. A rough sea equates to high winds and a calm
sea equates to light winds. This is especially useful for areas in the central and eastern Atlantic where hurricane hunters
don't fly, giving forecasters the first sign of development; however, there are a couple drawbacks to scatterometry.
First, these instruments are attached to polar orbiting satellites. As they make progressive passes around the Earth, blind
spots can occur, meaning a storm could be completely missed. Also, very heavy rain, which is common in a hurricane's
eyewall, contaminates the information being received.
Fortunately, this image below is fairly accurate, but some mistakes remain. Ivan's maximum sustained winds at this time
were 120 knots and the image shows several wind barbs with readings between 100 and 115 knots, however, the gray dots
near the eye mean that is the most likely location for errors. The SSM/I rainfall graphic on the right shows that it was raining
as high as 15 mm/hr. It's this heavy rain that causes mistakes, but the benefits far outweigh the drawbacks.
 |
 |
WIND ANALYSIS
Once a storm is closer to land, wind analyses from the Hurricane Research Division offer useful data to forecasters. These measurements are taken from a variety of resources, as shown in the figure below. Observations from GPS Dropwindsondes,
a moored buoy, a C-MAN station, a ship, a satellite and SMFR (which I will discuss later) went into making this detailed
image of Ivan's wind direction and wind speed ten meters above the surface, approximately 27 hours before landfall. The
circular contours around the eye represent Ivan's wind speed in knots and it shows exactly where the strongest winds are. In
this case, the worst winds are on the eastern side of the storm, which is common as the right-front quadrant of a hurricane is
often the most deadly.
The conclusion made from all these observations is on the bottom of this image: the analyzed maximum wind speed is 120
knots (near 140 mph) 23 nautical miles northeast of the center. This is the same as the NHC had the storm at this time. This
wind analysis is even more accurate than scatterometry; however, it is only taken closer to land, unlike scatterometry.
This is a wind analysis of Ivan, showing the exact locations of the strongest winds,
courtesy of the Hurricane Research Division.
I mentioned earlier that SMFR (Stepped Microwave Frequency Radiometer) is used in wind analysis, but you might be
wondering what that is. It is a tool mounted on NOAA's P3 aircraft that senses high level microwaves emitted from the
sea surface. If the sea surface is rough and foamy from high winds, more amounts of microwave energy are sent back
to the aircraft. Computer models are able then to calculate wind speeds from these measurements helping the NHC
determine the wind speed. On the bottom of the image above, SMFR measured a wind speed of 121 kts 21 nm NE of the
center of Ivan, basically the same as the analyzed max wind.
Even though Ivan weakened to a category 4 at this time and eventually a category 3 at landfall, it's a storm that will be
remembered for a long time. Not only did it cause massive destruction over a wide area, it also had one of the longest
tracks in history: an astonishing 5,600 nautical miles and a life span of 22 days.