Jackson, MS KJAN
Jackson, MS lies in the warm, humid southeastern Gulf states, where mid latitude storm systems still have a chance to pack a punch into winter, with severe possibilities and large temperature gradients accompanying frontal boundaries. It lies 45 miles east of the Mississippi River, and 150 miles north of the Gulf of Mexico, which almost constantly feeds moisture into the area on southeast winds. It's elevation is 291 ft. and it sits in low hills terrain. The timing of frontal boundaries and their subsequent cloud cover and precipitation proved to be one of our lessons learned for this city, the other being a reminder of the role the dry slot plays in a classic mid-latitude cyclone.
Forecast Week 1 for Jackson, MS KJAN - Week of November 6th
Forecast Period 06Z 11/10 - 06Z 11/11
Our Lesson Learned for this week was the discrepancy between the eWall progs and MOS guidance vs. clouds and the timing of an approaching frontal boundary (and warm sector ahead of the front)
In the discussion threads, the class was concerned with the timing of the arrival of the approaching frontal boundary, as this would impact the low temperature with regard to cloud cover vs. clear skies. If the front came in sooner, clouds would cause the low temperature to be higher, but if the front was slower to progress, then clear skies would prevail and a lower low temperature. In my post at 5:26 pm 11/9/06, I copied the following from the 316 pm CST 110906 AFD:
EXPECT LOWS TONIGHT MUCH WARMER THAN LAST NIGHT AND I REMAINED NEAR MAV (WHICH FEATURES A RANGE FROM LOWER 60S WEST TO LOWER 50S IN EASTERN MS).
COOL AIR WILL BEGIN TO FILTER INTO NORTHWEST ZONES BY SATURDAY MORNING WITH RAIN STARTING TO TAPER OFF FROM WEST TO EAST BY DAYBREAK.
Here is an excerpt from my notes: "I think I'm going with 52 as a spread between 56 and 50 (this cold front is going to take us here in Kansas City from a high today of 75 to temps dropping to mid-to-lower 40s during the day/by late afternoon tomorrow - it's potent)." MOS had given a spread for the low of 57/GFS, 54/ETA, and 54/NGM, and the Tabular had 58. [MOS from the NWS MOS Forecast Products page, Tabular and AFD from the local NWS site for Jackson.]
In my notes, I had put a low of 56 due to clouds moving in, winds picking up in the enlarging pressure gradient (the WRF 66 hour prog and the WRF 42 hour prog below, from the PSU eWall, show the tightening pressure gradient at 500 mb (upper left), 700 mb (lower left), and surface (upper right)), and KJAN being in the warm sector ahead of the frontal boundary. However, if you look at the two WRF progs for 42 and 66 hours, you can see that the pressure gradient is not as pronounced at KJAN as it is further to the north of the city.
|
|
|
| This prog from the PSU eWall shows the tightening pressure gradient at 500 mb (upper left), 700 mg (lower left), and surface (upper right) which caused the winds to pick up. This forecast image is for 66 hours prior to 06Z 11/11, and shows the low pressure trough to the northwest of Jackson . In addition, the lower left panel shows dry air over Jackson (30% RH), and the lower right panel shows the area of precipitation to the northwest. Click on image for a larger view. | This prog from the PSU eWall shows the tightening pressure gradient at 500 mb (upper left), 700 mb (lower left), and surface (upper right). This forecast image is for 42 hours prior to 06Z 11/11, and shows the low pressure trough now forecast to be more directly north of Jackson. The precipitation is still shown to the northwest of Jackson (lower right panel), but the drier air is below Jackson (50% RH on the lower left panel). Click on image for a larger view. |
Some discussion indicated that the cooler end of MOS would be the better bet since the high for the 9th had not climbed as high as anticipated, and that would affect the low. However, in another post it was cautioned that the progs might not be handling the clouds and the high Theta-E (warm) air well, and that if clouds were forecast to move in overnight, the high end of MOS would make more sense. Based on this, my forecast of 56 was valid. I changed it to 52 at the last minute because I thought the colder air would move in faster, with the frontal system already moving faster than progged. That's a bust of 6 degrees, whereas if I'd kept with the original 56 forecast, it would only have busted by 2 degrees.
I chose to compromise from my original 56 to 52 because I thought the cold front would have more of a punch. This cold front was potent, bringing severe weather with hail to Sedalia, Missouri upstream at 19Z 11/10 [Sedalia Meteogram]. I was also looking at the forecast low for Saturday night (though outside our forecast parameter) of 46 (from the Point-Zone AFD 7-Day Forecast), and thought the cold air might come in earlier since the system was moving faster than anticipated. The surface analysis maps below show the progression of the front from 12Z, to 15Z, to 18Z on 11/10. You can see the steady progression of the cold frontal boundary toward Jackson.
 |
 |
 |
| This surface analysis map, valid at 12Z on 11/10, shows the cold frontal boundary draped across West Texas and up through Central Oklahoma, to the northwest of Jackson. Image from the Hydrometeorological Prediction Center (HPC). Click on image for a larger view. | This surface analysis map, valid at 15Z on 11/10, shows the cold frontal boundary draped a little further southeast into west-central Texas and eastern Oklahoma, still to the northwest of Jackson but moving steadily. Image from the Hydrometeorological Prediction Center (HPC). Click on image for a larger view. | This surface analysis map, vlaid at 18Z on 11/10, shows the cold frontal boundary in north Texas and the border of Oklahoma and Arkansas, quickly approaching Jackson from the northwest. Image from the Hydrometeorological Prediction Center (HPC). Click on image for a larger view. |
However, the low forecast for Saturday night on MOS was 54/GFS, 58/ETA, and 54/NGM, with Tabular at 59. All models pointed toward a warmer low, accounting for the warm sector ahead of the front (and I should learn not to change a forecast drastically at the last minute after I'd already thought it out with sound reasoning and model guidance!). Actual low temperature, from the 11/10 Climate Report, came in at 58 at 12Z w/ rain and light winds (top end Friday, Zone and Tabular were right with a tad higher temp than MOS). The meteogram below illustrates the rain at 10Z-13Z 11/10, which with the light winds, served to foster evaporational cooling. The low of 58 occurs at 12Z within this rain parameter, indicating the models and MOS had a handle on the RH and precipitation probability in relation to the low temperature.
 |
| This meteogram from the University of Wyoming Surface Observations website shows the rain recorded at 10Z-13Z 11/10 and the low temperature of 58 at 12Z. The high temp reached 79 19Z and 22Z with partly cloudy skies. |
Reflections
I made the same mistake here that I did for Orlando, FL when a strong frontal boundary was slated to come through there. However, I thought I was more comfortable with a southern state because I know frontal boundaries that have strong dynamics and large gradients do have an effect in this region of the country. In fact, the Gulf states are notorious for having thunderstorms and severe weather when their neighbors to the north are having cold, snow and/or a mix with the same frontal boundary. Of course, I'm talking specifically here about November, when winter visits the northern states before it arrives in the southern states.
Being upstream in Kansas City, I thought I had a pretty good idea of how this same cold front would affect Jackson. As I stated above, this front packed a punch, and dropped our temperatures by 30-35 degrees in a few hours. Also, it brought severe weather to Sedalia, just to the east-southeast of Kansas City. I felt sure it would have the same effect in Jackson, only a few hundred miles to the southeast. I had originally had the forecast high of 56 because I was paying close attention to the discussion on the boards, and figured I might be making the same mistake again. However, at the last minute, I changed the high to 52 because I once again swung for being certain the front would hold more power.
What did I learn from this? Never assume! However, historically when we have severe weather here in the Heartland, it typically garners strength as it moves east and hits the Kentucky/Tennessee area even harder. Since Jackson is to the south of this area, I figured the same effects would be felt there. Plus, knowing Gulf moisture plays a key role in any weather in the southeast states, I felt sure it would boost the frontal boundary with that warm, moist air. I should have paid more attention to the upper air dynamics, and looked at more of the synoptic items rather than just upstream events.
Forecast Week 2 for Jackson, MS KJAN - Week of November 13th
Forecast Periods 06Z 11/15 - 06Z 11-16 and 06Z 11/14 - 06Z 11/15
For this week, our Lesson Learned was the relationship of high temperature with clearing skies in the dry slot of a classic cyclone model and the timing of precipitation between forecast periods. the dry slot should not have been a surprise to us, since we learned about that in Meteo 101 and Meteo 361, but part of our learning process is taking what we've learned and relating it to the real weather that occurs. This was a perfect chance for that. I've broken the two pieces up into separate sections. The dry slot situation is the lesson learned, but I wanted to mention the precipitation since it was an issue, as well.
High Temperature with Clearing Skies in Dry Slot of Classic Cyclone Model: The main bust was the high temp on the 15th due to the dry slot behind the front (classic cyclone model) clearing skies in time for afternoon heating to do its work. This was forecast well by the models, as shown by the AVN 30 hr, WRF 30 hr and WRF 12 hr progs (AVN Prog 30 hr V 18-15 Dry Slot, WRF Prog 30 hr V 18-15 Dry Slot, WRF Prog 12 hr V 12-16 Dry Slot) - note the 700 mb RH% in the lower left box and you can see the tongue of brown coming up across MS behind the green. The tongue of brown indicates 30% RH and the green indicates 70% RH, meaning that the air was moist in the baroclinic zone (green) and dry behind it (brown). My forecast of 64 for the high on 11/15/06 was a compromise between MOS 14, Tabular, and Point-Zone 1219 / Point-Zone 520 which seemed in fair agreement (MOS-GFS 66/MOS-ETA 66/MOS-NGM 63/Tab 65/AFD 65). Actual high came in at 72, which was a result of afternoon heating under the dry slot (see water vapor satellite at Sat WV 1645 Dry Slot, visible satellite at Sat Vis 1655 Dry Slot, and infrared satellite at Sat IR 1715 Dry Slot). These images show the progression of the dry slot with its clear skies and dry air. The image below shows the wrap-around clouds about to move into the Jackson area.
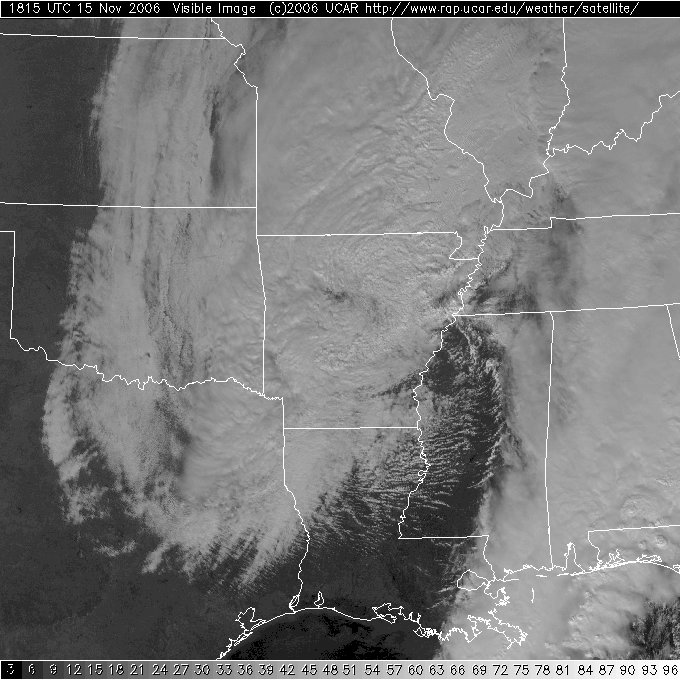 |
| This visible satellite image valid 1815Z 11/15 shows the dry slot over the Jackson area, with the wrap-around cloud cover from the mid-latitude cyclone (low pressure system) about to move into the Jackson area. Image courtesy of RAP-NCAR site. |
The meteogram on the left below shows the rain at 22Z-23Z on 11/14 and the low temp of 58 from 23Z 11/14 - 01Z 11/15. The meteogram on the right for 11/15 shows the light rain at 07Z-08Z, then steadier rain at 09Z, the thunderstorm at 15Z, the high temp of 72 at 18Z-19Z with southwest winds and mostly clear skies. Then the wrap-around clouds move in around 00Z-01Z 11/15, the wind changes direction from south to west during the thunderstorm, then to the west-northwest at 17Z. More rain moves in at 02Z and again at 05Z-06Z, at which time (06Z) the temp reaches 46 with the CAA.
 |
 |
| This meteogram from the University of Wyoming Surface Observations website shows the rain at 22Z-23Z 11/14 and the low temp of 58 at 22Z 11/14 - 01Z 11/15. Click on image for a larger view. | This meteogram from the University of Wyoming website shows the rain at 07Z-08Z 11/15 with heavier rain at 09Z 11/15, the thunderstorm at 15Z11/15, followed by clearing skies and the high temp of 72. The winds shift at 02Z 11/16 from west to west-northwest, it clouds back up with the wrap-around from the low pressure system at 00Z-01Z 11/16, and more rain falls at 02Z 11/16 and again at 05Z-06Z 11/16. The temp at 06Z 11/16 is recorded at 46. Click image for a larger view. |
The classic cyclone model is in the shape of a comma, with the comma head being the occluded (mature) part of the low pressure system. The clouds in this part of the low pressure system wrap around with the cyclonic flow bringing possible precipitation back down behind the dry slot, which comes up behind the frontal boundary, making the comma shape. The dry slot is dry air that is brought down into the system from upper levels and is wrapped into the system with the cyclonic flow. The dry slot is illustrated on the meteogram on the right after the thunderstorm at 16Z-21Z. An illustration of the classic cyclone model can be found below, courtesy of the Pennsylvania State University course images for Meteo 101.
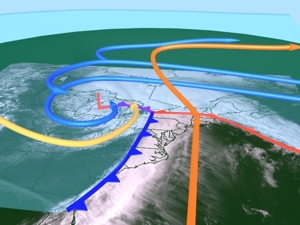 |
| This image of the classic cyclone model comes from the Penn State Univ Meteo 101 course images. You can see the comma shape in the clouds. The blue barbed line represents the cold frontal boundary, and the red rounded-barb line represents the warm frontal boundary. The purple mixed-barb line is the occlusion of the low pressure system. The orange line represents the warm air advection (WAA) in the warm sector ahead of the front. The yellow line to the left shows the dry conveyor belt, which gives us the dry slot. The blue lines at the top are the cold conveyor belt, showing the cold air advection (CAA) that's getting wrapped into the system. |
Timing of Precipitation between Forecast Periods: The biggest challenge with this forecast period was how soon the rain from the potent frontal boundary would move in. The system ended up moving in faster than models indicated, and the majority of the precipitation came in earlier than anticipated. This affected two forecast periods, and busted precipitation on both by forecasting less on the 14th-15th and more on the 15th-16th. Forecast through 06Z 11/15 was for 0.05 for rain and actual was 0.27 because the rain moved in quicker than anticipated, leaving the forecast through 06Z 11/16 of 0.50 busted as actual was 0.30. I used the SREF ensembles for help with precipitation for 11/15-11/16 (SREF 63 hr V 6-15, SREF 39 hr V 6-15, and the SREF 45 hr V 6-16 and SREF 21 hr V 6-15). The 63 hr SREF shows KJAN barely in the zone for 0.01-0.05 inches. The 39 hr SREF shows the precipitation at 0.01-0.10, giving it a bit higher chance amount. These two SREF images are from the PSU eWall. The 45 hr SREF shows Jackson in the .25-.50 category, but by the 21 hr SREF the amount had gone down to 0.01-0.10. These two SREF images are from the NCEP Model Analyses and Forecasts website.
This excerpt from the 06Z 11/14-06Z 11/15 METARS shows the rain that occurred ahead of the frontal boundary (METARS found at the Department of Atmospheric Sciences - Texas A&M University site):
KJAN 142015Z 18009G15KT 2 1/2SM +RA SCT023 BKN031 BKN039 17/13 A2974 RMK AO2
RAB11 P0002=
KJAN 142017Z 19007G15KT 1 3/4SM +RA BKN023 BKN029 BKN036 17/14 A2974 RMK AO2
RAB11 P0003=
KJAN 142035Z 17008KT 4SM -RA BR FEW014 BKN023 OVC055 16/14 A2972 RMK AO2 RAB11
P0014=
KJAN 142043Z 17009KT 9SM SCT021 BKN036 OVC060 16/14 A2972 RMK AO2 RAB11E41 P0015=
KJAN 142054Z 17012KT 10SM SCT017 BKN036 OVC060 16/14 A2971 RMK AO2 RAB11E41 SLP058 P0015 60015 T01610144 56031= KJAN 142118Z 17010KT 4SM RA BR BKN017 BKN034 OVC060 16/14 A2971 RMK AO2 RAB07
P0000= KJAN 142122Z 18009KT 1SM +RA BR BKN017 BKN034 OVC060 15/14 A2972 RMK AO2 TWR
VIS 2 1/2 RAB07 P0001=
KJAN 142136Z 17010KT 3SM -RA BR OVC015 15/14 A2971 RMK AO2 RAB07 P0012= KJAN 142154Z 16008KT 6SM BR OVC015 15/13 A2970 RMK AO2 RAB07E40 SLP056 P0012
T01500133= KJAN 142212Z 17009KT 6SM -RA BR OVC013 14/13 A2969 RMK AO2 RAB03 P0000=
|
The 60015 reading at 2054Z shows the accumulated precipitation total for the past 3-6 hours (0.15 inches) and the last P0012 at 2154Z indicates hourly precipitation of 0.12 more, making the total up until 06Z 0.27. These were the scattered rain showers forecast in the Hazardous Weather Outlook (see below) ahead of the frontal boundary.
A squall line was forecast to evolve from the initially scattered thunderstorms that would develop ahead of the cold front, from the 12:35 pm CST Hazardous Weather Outlook (HWO 1235 14), as noted in this excerpt:
A POWERFUL UPPER LEVEL DISTURBANCE DIGGING SOUTHEAST FROM THE CENTRAL ROCKIES TODAY WILL SPIN UP A DEEPENING SURFACE LOW OVER
THE RED RIVER VALLEY THAT WILL MOVE ACROSS THE ARKLATEX THIS EVENING. ISOLATED SEVERE THUNDERSTORMS WILL BE POSSIBLE OVER
WEST AND SOUTHWEST AREAS BY LATE AFTERNOON AHEAD OF A WARM FRONT THAT WILL LIFT INTO LOUISIANA TODAY AND PIVOT INTO WEST
MISSISSIPPI THIS EVENING. DEEP MOISTURE AND WIND SHEAR WILL INCREASE RAPIDLY ALONG AND BEHIND THE WARM FRONT. THIS WILL ALLOW
THUNDERSTORMS TO ERUPT AHEAD OF THE APPROACHING COLD FRONT TONIGHT. THESE STORMS SHOULD INITIALLY BE SCATTERED IN NATURE IN
THE WESTERN HALF OF THE OUTLOOK AREA TONIGHT BUT THEN EVOLVE INTO A SQUALL LINE AS THEY MOVE FARTHER EAST AFTER MIDNIGHT. SEVERE
STORMS WILL HAVE THE POTENTIAL FOR DAMAGING WIND GUSTS...LARGE HAIL AND TORNADOES. THE PRIMARY TORNADO RISK WILL OCCUR LATE
TONIGHT AND A FEW STRONG TORNADOES WILL BE POSSIBLE.
The squall line did develop and moved through quickly Wednesday morning and was east of KJAN well before noon (as can be seen on these radar images Radar 1327Z Squall Line west from the RAP-NCAR Radar site, and Radar 1428Z Squall Line east from the Storm Prediction Center (SPC) site), and shown on the meteogram below. Note the thunderstorm symbol at 15Z and the change in wind direction at 17Z. By 2031Z, the squall line had fallen apart into a solid rain band Radar 2031Z Rain Band (from the RAP-NCAR Radar site).
 |
| This meteogram from the Plymouth State Weather Center shows the thunderstorm associated with the squall line at 15Z (9:00 am CST) and the change in wind direction associated with the passage of the front at 17Z (11:00 am CST). Note the rain at 09Z (3:00 am CST) indicating part of the precip that came in before the end of the last forecast period. |
Here are the METARS for 06Z 11/15-06Z 11/16, which show the thunderstorm at 14Z-15Z.
KJAN 151421Z 24016G26KT 1/2SM
+TSRA BR FEW013 SCT021 BKN034 21/19 A2944 RMK AO2 PK WND 25026/1421 SFC VIS 2 TSB20RAB01 PRESRR OCNL LTGICCG SW-N AND E TS SW-N
AND E MOV NE P0001= KJAN 151428Z 24012G30KT 190V270 1/2SM +TSRA FG BKN017 BKN031 BKN070 19/17 A2940
RMK AO2 PK WND 25030/1425 TSB20RAB01 OCNL LTGICCG SW-N AND E TS SW-N AND E MOV
NE P0026= KJAN 151435Z 23007G28KT 2SM -TSRA BKN020 BKN043 OVC100 20/17 A2940 RMK AO2 PK
WND 25030/1425 TSB20RAB01 OCNL LTGICCG NE-SE TS NE-SE MOV NE P0027=
KJAN 151442Z 23008G14KT 6SM TSRA BKN024 BKN041 OVC075 20/17 A2941 RMK AO2 PK
WND 25030/1425 TSB20RAB01 OCNL LTGICCG E-SE TS E-SE MOV NE P0028=
KJAN 151454Z VRB04KT 10SM -TSRA BKN030 BKN080 BKN100 20/18 A2941 RMK AO2 PK WND
25030/1425 TSB20RAB01 SLP955 O= KJAN 151454Z VRB04KT 10SM -TSRA BKN030 BKN080 BKN100 20/18 A2941 RMK AO2 PK WND
25030/1425 TSB20RAB01 SLP955 OCNL LTGICCG E-S TS E-S MOV NE P0029 60029
T02000178 55004= |
"OCNL KTGICCG" stands for occasional lightning - intra-cloud, or cloud to cloud, and cloud to ground. This was during the squall line's passage over Jackson.
If you'd like to read through the Area Forecast Discussions to see how the storm and the squall line progressed, I've included the links below. Also, I've provided links to the Mesoscale Discussion and two Hazardous Weather Warnings that went along with the AFDs.
AFD 355 13 AFD 1219 13 AFD 359 13 AFD 941 13 AFD 413 14 AFD 710 14
MD 240 14 HWO 1235 14 HWO 1227 15
Reflections
So this time the potent system dynamics didn't disappoint me, and a squall line came through Jackson. However, it still wasn't as strong as I'd thought it would be. Again, upstream assuming. But the real lesson was that we should never forget the basics - the classic cyclone model gives us a map, and many of us in the class didn't see what was right in front of us - the dry slot. This caused us yet another problem with clouds and an afternoon high. I included the image above of the classic cyclone model more for my own benefit than as illustration, because I need to burn this image into my mind. It should be easy to remember, since it's illustrated by the classic comma shape, but this lesson made me realize how easily it is to forget the basics after we've learned to look at other things.
I used the SREF ensembles again for the precipitation forecast, and found them very helpful except for one thing - even they, being models, didn't know the system would accelerate. So that instead of on the top end, the bulk of the precipitation occurred on the bottom end of the forecast period.
All in all, I'd still rather forecast for a midwestern or southern city because thunderstorms and strong frontal boundaries are my favorite kinds of weather. I find them more intense and exciting, and of course a challenge to forecast since severe weather can happen so quickly. Adrenaline.