| |
| George R. Kasica
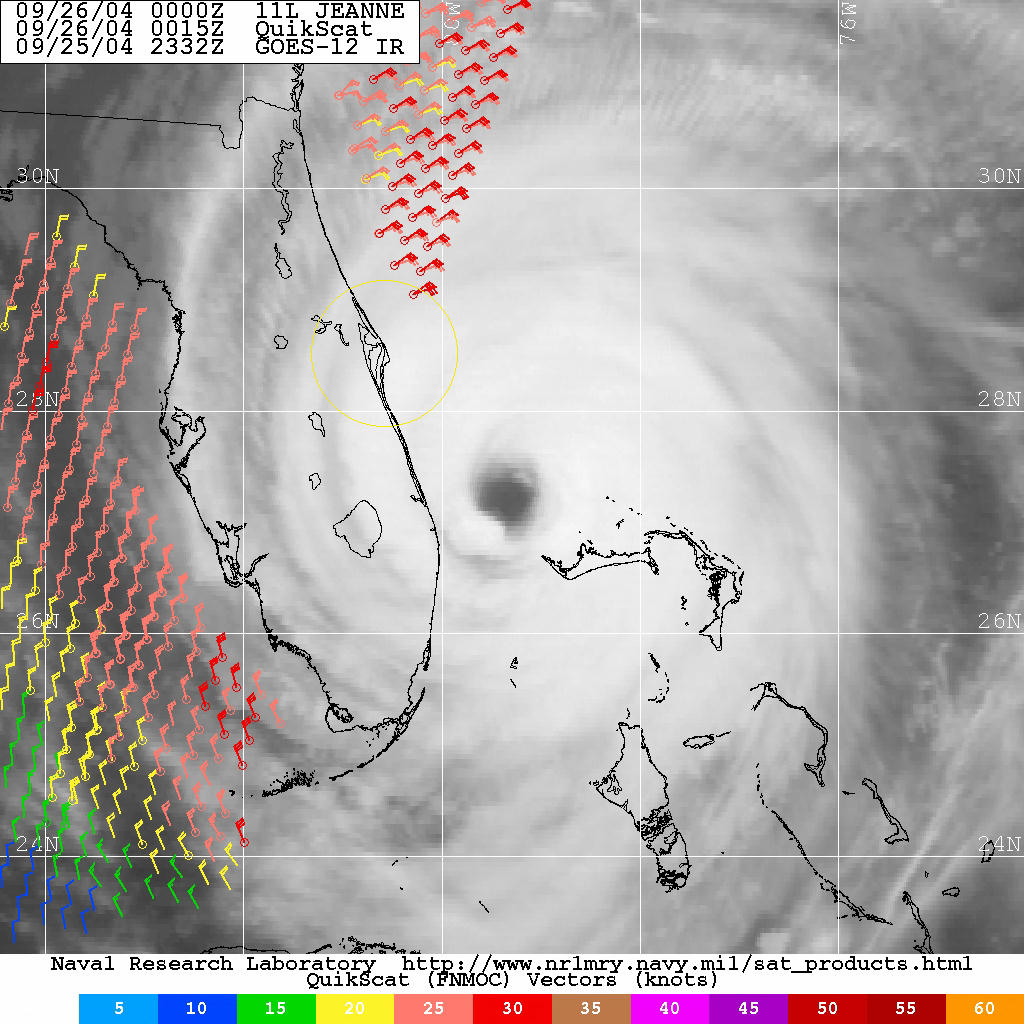
METEO 241 Portfolio #1: Remote Sensing as it relates to tropical cyclones The Scatterometer Data
Above you can see a computer generated image from, which is actually a combination of a satellite image as well as data returned by an instrument onboard the satellite known as a scatterometer (click the link for a detailed description of the instrument and its function) which is able to sense and calculate wind speed and direction from space. In the image above you can see the winds from Hurricane Jeanne are at a maximum of around 60 kts based on its measurements An interesting thing to note on this image is the fact that there is a large area of missing wind data in the image. This area of missing data is typically caused by one of two things: areas of very heavy rain blocking (or attenuating) the returning signals from the surface of the ocean back to the satellite sensors or by the fact that there are gaps in the coverage of the satellite when it passes over an area. These gaps in the data are due to the fact that the satellites carrying the scatterometer are polar orbiting devices and they do not stay over one point on the Earth's surface as we are used to with a typical GOES satellite. Instead they pass over almost the same area twice in a 24 hour period. Its this moving track that causes the data to have missing areas in its coverage as the path is not exactly the same each day. Based on the very even cutoff of the data you see above, it would be my supposition that the data gathering pass was just able to catch the very edge of the storm at this time period and that explains the lack of data on the majority of the "right" half of the storm. From looking at the data available however you can see that the areas near to the Cocoa Beach and Kennedy Space Center locations (the area within the yellow circle) that winds are likely near the 55-60kt range or higher but are not getting detected. In this case, it is most likely due to heavy rain blocking the reflected signals from reaching the satellite.
Our next data item is called a wind analysis
to learn more about it click the Next Button below or to go back to the
Vortex Data Message click the Previous Page button or to return to the
main page click the Home Button.
|