
| |
| George R. Kasica
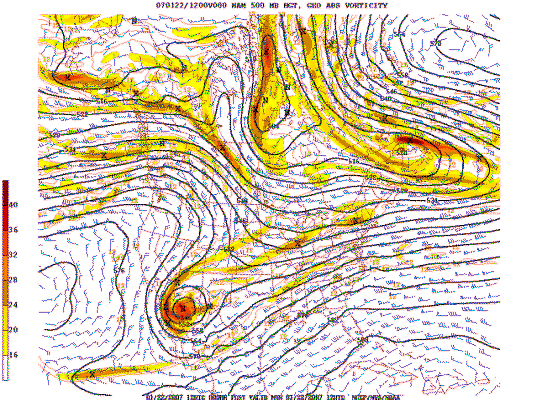
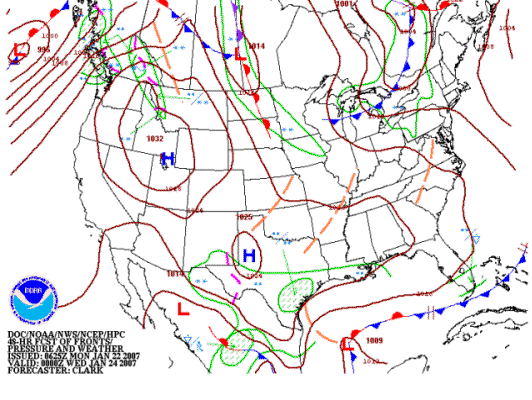
San Antonio Forecast Day #1 - 0600Z January 23 to 0600Z January 24, 2007 The first day of the forecasting period was Tuesday, January 23rd and the time period it covered was actually from 0600Z on the 23rd to 0600Z on the 24th due to the fact that San Antonio, Texas is 6 hours behind the time in Greenwich, thus the offset of 6 hours rather than a midnight to midnight time frame. The main challenges to this forecast period seemed to be to predict the timing and amount of precipitation for San Antonio. This was due in part to an approaching low pressure system. As you can see in the initial 12Z 500mb chart on the left below and further by the forecast surface map for the next day at 6pm (0000Z) on the right there is an area of precipitation forecast to be not far from the eastern edge of the San Antonio Area. Being in this location indicated that it may very well have moved directly over the forecast area during the period, so I would have to carefully consider the amount of precipitation and when it would arrive and in what quantity.
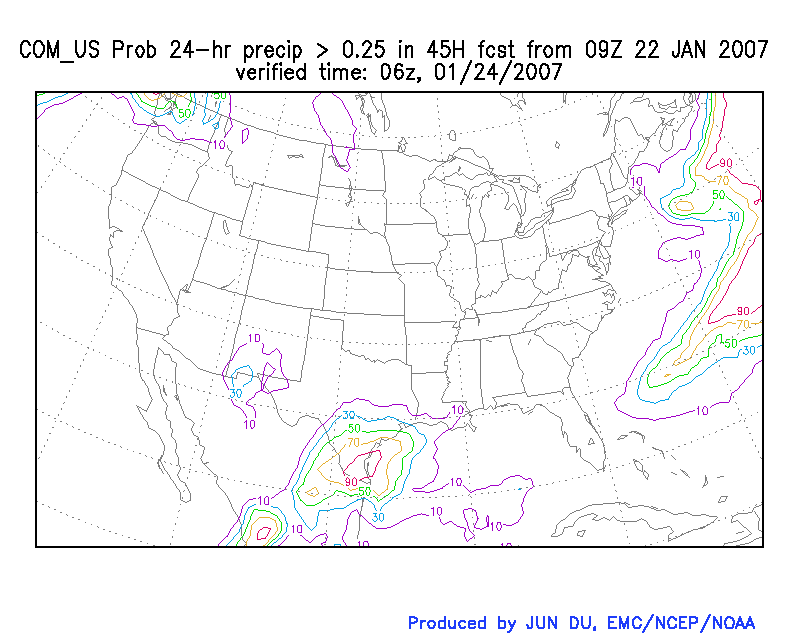
To try to help out with this process of timing and the quantity of precipitation I looked at several sources of data, namely the 45 hour short range forecast for precipitation greater than 0.25" (provided courtesy of the UCAR SREF Ensemble Forecasting web site), and the 12Z Model Output Statistics (known as MOS and provided courtesy of the National Weather Service Meteorological Development Lab) as well as another model product known as FOUS, also from 12Z on January 22, 2007 (provided via the Rutgers University Meteorology Program Web Site). In looking at these various pieces of data, one thing was very clear, there would likely be precipitation at San Antonio during this 24 hour forecast period, the question was how much? The SREF chart from above indicated that the chances for more than 0.25" of precipitation were about 30% but they rapidly climbed to over 70% or dropped to near 0% over a very short distance, indicating that the forecast was not certain by any means. Looking at the FOUS data mentioned above it gave the indication of anywhere from 0.19" up to 0.89" of precipitation (bold green highlights in detail screen). Given that the other indications showed a low chance to exceed a 0.25" amount I chose to be conservative and call for 0.30" of precipitation, a bit more than was forecast by the one model, but still within range of what the other data was indicating was a reasonable probability since the chances of exceeding 0.25" was only given at about 30%. The temperature and wind forecasts were not nearly as complex and difficult as the precipitation as the area was forecast to be under a cool, cloudy environment throughout the day and in looking at the MOS forecasts I saw that the three had predicted high temperatures of 41, 46 and 48 for high temperatures and 35, 38 and 38 for lows. I chose to take something of an average for the high at 44 and moderate the low temperature upwards a few degrees due to the cloud cover and keep it at 39. The wind speeds were 8, 10 and 12 knots and I chose to go with an average value of 10 knots (15 mph) as there was little reason to deviate away from what the models were predicting. The actual results for the day were not that far off from what I had predicted for the temperatures with a high of 45, low of 40 and winds of 17 mph, but I did not fare as well with the precipitation amounts as only a precipitation total of 0.13" was recorded. For details of these items you can see the relevant coded METARS below and the full day of METARS and Climate Summary can be found here: For the temperatures you can see the high temperature occurred at 2053Z and was 7.2C degrees or 45F(red, bold, underlined item) and the low 4.4C or 40F which occurred some time in the 6 hours ending at 1753Z (blue, bold, underlined item) KSAT
232053Z 01010KT 10SM OVC044 07/01 A3020 RMK AO2 SLP219 60001
T00720011 58010 The precipitation total was obtained by the 6 hourly precipitation totals listed and highlighted below in bold, green underlines which are 0.01" for the 6 hours ending at 1753Z and another 0.01" for the 6 hours ending at 2353Z and finally 0.11" for the 6 hours ending at 0553Z for a total of 0.13". KSAT 231753Z
03012KT 10SM -RA BKN044 OVC060 06/02 A3023 RMK AO2 SLP229 P0000
60001 T00610017 10061 20044 50008 The maximum wind gust was shown in the daily climatic summary from above to be 17 mph. The one item I feel that was a problem with the forecast was the timing of the precipitation, as just a few hours later as shown by the following METAR from 0853Z, San Antonio did in fact receive a substantial additional amount of rain of 0.14" in just 3 more hours which if it had arrived as I had forecast would have given a total of 0.28", which is just a small amount below the forecast 0.30" total. KSAT 240853Z 34004KT 9SM -RA OVC040 05/03 A3024 RMK AO2 SLP234 P0001 60014 T00500033 58008 Overall, for my first attempt at forecasting for San Antonio, I felt it went relatively well, though I do see an area of improvement is that I need to work on more accurate forecasting for the timing of when precipitation will actually occur. |